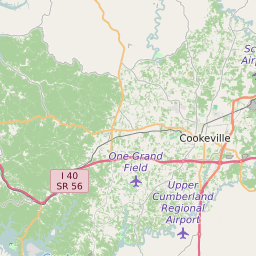
38506 can be classified socioeconomically as Lower Middle Class class compared to other ZIP Codes in Tennessee based on Median Household Income and Average Adjusted Gross Income. The majority race/ethnicity residing in 38506 is White. The majority race/ethnicity attending public schools in 38506 is White. The current unemployment level in 38506 is 3.5%.
| Population | 29,243 |
| Population Growth Rate | 0.58% |
| Population Density | 179 People per Square Mile |
| Total Households | 10,089 |
| Percentage High Income Households | 1.8% |
| Median Household Income (2021) | $54,003 |
| Average Adjusted Gross Income (2021) | $482,830 |
| Current Unemployment Rate (February 2025) | 3.5% |
| Majority Race/Ethnicty | White - 95.14% |
| Public School Majority Race/Ethnicty | White - 83.32% |
38506 Race/Ethnicty Breakdown
| Race/Ethnicty | Total | Percentage |
|---|
| White | 27,436 | 95.14% |
| Black | 149 | 0.52% |
| Hispanic | 996 | 3.45% |
| Asian | 205 | 0.71% |
| Native American | 52 | 0.18% |
| Hawaiian/Pac. Islander | 0 | 0% |
38506 Public School Race/Ethnicty Breakdown
| Race/Ethnicty | Total | Percentage |
|---|
| White | 2,418 | 85.08% |
| Black | 91 | 3.2% |
| Hispanic | 292 | 10.27% |
| Asian | 40 | 1.41% |
| Native American | 0 | 0% |
| Hawaiian/Pac. Islander | 1 | 0.04% |
38506 Educational Attainment Levels
| Highest Education Level Attained | Total | Percentage |
|---|
| Less Than 1 Year of College | 1,071 | 7.17% |
| Bachelor Degree | 2,693 | 18.02% |
| High School Diploma | 5,166 | 34.57% |
| No High School Diploma | 376 | 2.52% |
| GED or Alternate | 1,232 | 8.24% |
| 1 or More Years of College | 2,169 | 14.52% |
| Associates Degree | 941 | 6.3% |
| Masters Degree | 896 | 6% |
| Professional Degree | 194 | 1.3% |
| Doctorate Degree | 205 | 1.37% |