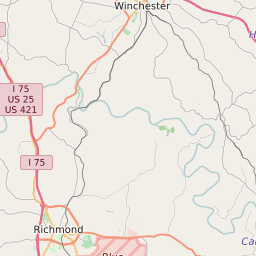
40337 can be classified socioeconomically as Lower Middle Class class compared to other ZIP Codes in Kentucky based on Median Household Income and Average Adjusted Gross Income. The majority race/ethnicity residing in 40337 is White. The current unemployment level in 40337 is 5.1%.
| Population | 5,518 |
| Population Growth Rate | 19.17% |
| Population Density | 101 People per Square Mile |
| Total Households | 2,049 |
| Percentage High Income Households | 1.7% |
| Median Household Income (2021) | $45,334 |
| Average Adjusted Gross Income (2021) | $135,730 |
| Current Unemployment Rate (February 2025) | 5.1% |
| Majority Race/Ethnicty | White - 97.99% |
40337 Race/Ethnicty Breakdown
| Race/Ethnicty | Total | Percentage |
|---|
| White | 5,763 | 97.99% |
| Black | 3 | 0.05% |
| Hispanic | 111 | 1.89% |
| Asian | 4 | 0.07% |
| Native American | 0 | 0% |
| Hawaiian/Pac. Islander | 0 | 0% |
40337 Educational Attainment Levels
| Highest Education Level Attained | Total | Percentage |
|---|
| Less Than 1 Year of College | 348 | 11.98% |
| Bachelor Degree | 141 | 4.86% |
| High School Diploma | 1,310 | 45.11% |
| No High School Diploma | 52 | 1.79% |
| GED or Alternate | 382 | 13.15% |
| 1 or More Years of College | 405 | 13.95% |
| Associates Degree | 176 | 6.06% |
| Masters Degree | 65 | 2.24% |
| Professional Degree | 25 | 0.86% |
| Doctorate Degree | 0 | 0% |