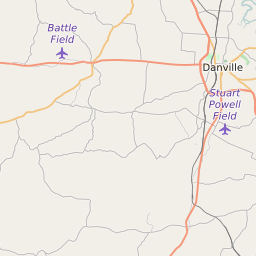
40437 can be classified socioeconomically as Lower Middle Class class compared to other ZIP Codes in Kentucky based on Median Household Income and Average Adjusted Gross Income. The majority race/ethnicity residing in 40437 is White. The majority race/ethnicity attending public schools in 40437 is White. The current unemployment level in 40437 is 5.1%.
| Population | 4,814 |
| Population Growth Rate | 0.00% |
| Population Density | 55 People per Square Mile |
| Total Households | 1,988 |
| Median Household Income (2021) | $49,104 |
| Average Adjusted Gross Income (2021) | $344,100 |
| Current Unemployment Rate (February 2025) | 5.1% |
| Majority Race/Ethnicty | White - 99.49% |
| Public School Majority Race/Ethnicty | White - 90.86% |
40437 Race/Ethnicty Breakdown
| Race/Ethnicty | Total | Percentage |
|---|
| White | 4,912 | 99.49% |
| Black | 0 | 0% |
| Hispanic | 16 | 0.32% |
| Asian | 9 | 0.18% |
| Native American | 0 | 0% |
| Hawaiian/Pac. Islander | 0 | 0% |
40437 Public School Race/Ethnicty Breakdown
| Race/Ethnicty | Total | Percentage |
|---|
| White | 348 | 95.6% |
| Black | 2 | 0.55% |
| Hispanic | 10 | 2.75% |
| Asian | 3 | 0.82% |
| Native American | 1 | 0.27% |
| Hawaiian/Pac. Islander | 0 | 0% |
40437 Educational Attainment Levels
| Highest Education Level Attained | Total | Percentage |
|---|
| Less Than 1 Year of College | 112 | 4.31% |
| Bachelor Degree | 102 | 3.92% |
| High School Diploma | 1,257 | 48.35% |
| No High School Diploma | 105 | 4.04% |
| GED or Alternate | 391 | 15.04% |
| 1 or More Years of College | 211 | 8.12% |
| Associates Degree | 249 | 9.58% |
| Masters Degree | 132 | 5.08% |
| Professional Degree | 41 | 1.58% |
| Doctorate Degree | 0 | 0% |