ZIP Code 40943 Quick Stats
| ZIP Code Name | Girdler |
| Primary County | Knox County |
| ZIP Code Type | Standard |
| Population (2022) | 750 |
| Area Code(s) | 606 |
| Current Time | EDT |
40943 Demographics
The majority race/ethnicity residing in 40943 is White. The majority race/ethnicity attending public schools in 40943 is White. The current unemployment level in 40943 is 5.1%.
| Population | 750 |
| Population Growth Rate | 13.16% |
| Population Density | 121 People per Square Mile |
| Total Households | 329 |
| Average Adjusted Gross Income (2021) | $92,200 |
| Current Unemployment Rate (February 2025) | 5.1% |
| Majority Race/Ethnicty | White - 100.00% |
| Public School Majority Race/Ethnicty | White - 97.90% |
40943 Race/Ethnicty Breakdown
| Race/Ethnicty | Total | Percentage |
|---|---|---|
| White | 657 | 95.49% |
| Black | 0 | 0% |
| Hispanic | 0 | 0% |
| Asian | 0 | 0% |
| Native American | 0 | 0% |
| Hawaiian/Pac. Islander | 31 | 4.51% |
40943 Public School Race/Ethnicty Breakdown
| Race/Ethnicty | Total | Percentage |
|---|---|---|
| White | 327 | 99.39% |
| Black | 0 | 0% |
| Hispanic | 2 | 0.61% |
| Asian | 0 | 0% |
| Native American | 0 | 0% |
| Hawaiian/Pac. Islander | 0 | 0% |
40943 Educational Attainment Levels
| Highest Education Level Attained | Total | Percentage |
|---|---|---|
| Less Than 1 Year of College | 7 | 2.41% |
| Bachelor Degree | 0 | 0% |
| High School Diploma | 174 | 60% |
| No High School Diploma | 30 | 10.34% |
| GED or Alternate | 52 | 17.93% |
| 1 or More Years of College | 9 | 3.1% |
| Associates Degree | 18 | 6.21% |
| Masters Degree | 0 | 0% |
| Professional Degree | 0 | 0% |
| Doctorate Degree | 0 | 0% |
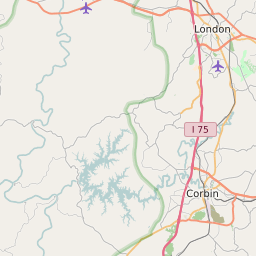
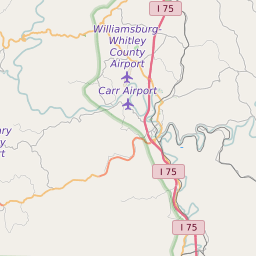
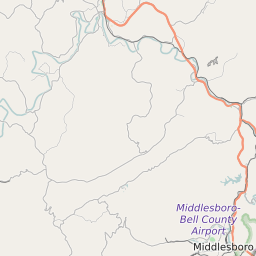
40943 Geography
| Coordinates | 36.95656967,-83.85901642 |
| Adjacent ZIP Codes | |
| Region | Cumberland Plateau Region |
| Metropolitan/Micropolitan Stat Area | London, KY |
| Time Zone | Eastern Daylight Time |
| IANA Timezone | America/New_York |
| Area | 6 Square Miles |
40943 Schools
| School Districts in 40943 |
40943 Weather and Climate Data
| Plant Hardiness Zone | Zone 6b: -5F to 0F | ||||||||||||||||||||||||||||||||||||||||||||||||||||||||||||||||||||||
| Average First Frost Date | October 11 - 20 | ||||||||||||||||||||||||||||||||||||||||||||||||||||||||||||||||||||||
| Average Last Frost Date | April 21 - 31 | ||||||||||||||||||||||||||||||||||||||||||||||||||||||||||||||||||||||
| Koppen-Geiger Climate Zone | Cfa - Humid Subtropical Climate | ||||||||||||||||||||||||||||||||||||||||||||||||||||||||||||||||||||||
| Ecoregion | 69d - Dissected Appalachian Plateau | ||||||||||||||||||||||||||||||||||||||||||||||||||||||||||||||||||||||
| |||||||||||||||||||||||||||||||||||||||||||||||||||||||||||||||||||||||