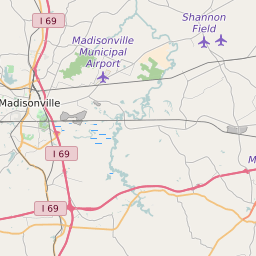
42367 can be classified socioeconomically as Lower Middle Class class compared to other ZIP Codes in Kentucky based on Median Household Income and Average Adjusted Gross Income. The majority race/ethnicity residing in 42367 is White. The current unemployment level in 42367 is 4.8%.
| Population | 886 |
| Population Growth Rate | 28.88% |
| Population Density | 669 People per Square Mile |
| Total Households | 274 |
| Median Household Income (2021) | $43,958 |
| Average Adjusted Gross Income (2021) | $95,700 |
| Current Unemployment Rate (January 2025) | 4.8% |
| Majority Race/Ethnicty | White - 99.52% |
42367 Race/Ethnicty Breakdown
| Race/Ethnicty | Total | Percentage |
|---|
| White | 834 | 99.52% |
| Black | 0 | 0% |
| Hispanic | 4 | 0.48% |
| Asian | 0 | 0% |
| Native American | 0 | 0% |
| Hawaiian/Pac. Islander | 0 | 0% |
42367 Educational Attainment Levels
| Highest Education Level Attained | Total | Percentage |
|---|
| Less Than 1 Year of College | 11 | 3.06% |
| Bachelor Degree | 10 | 2.78% |
| High School Diploma | 172 | 47.78% |
| No High School Diploma | 8 | 2.22% |
| GED or Alternate | 68 | 18.89% |
| 1 or More Years of College | 64 | 17.78% |
| Associates Degree | 18 | 5% |
| Masters Degree | 9 | 2.5% |
| Professional Degree | 0 | 0% |
| Doctorate Degree | 0 | 0% |