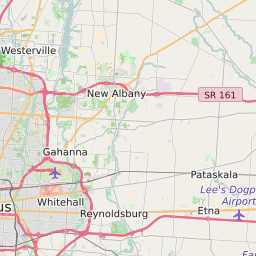
43004 can be classified socioeconomically as Middle Class class compared to other ZIP Codes in Ohio based on Median Household Income and Average Adjusted Gross Income. The majority race/ethnicity residing in 43004 is White. The majority race/ethnicity attending public schools in 43004 is White. The current unemployment level in 43004 is 4.2%.
| Population | 31,002 |
| Population Growth Rate | 19.92% |
| Population Density | 2,447 People per Square Mile |
| Total Households | 8,904 |
| Percentage High Income Households | 6.8% |
| Median Household Income (2021) | $89,318 |
| Average Adjusted Gross Income (2021) | $526,260 |
| Current Unemployment Rate (February 2025) | 4.2% |
| Majority Race/Ethnicty | White - 57.27% |
| Public School Majority Race/Ethnicty | White - 44.81% |
43004 Race/Ethnicty Breakdown
| Race/Ethnicty | Total | Percentage |
|---|
| White | 17,061 | 57.27% |
| Black | 8,109 | 27.22% |
| Hispanic | 1,558 | 5.23% |
| Asian | 2,976 | 9.99% |
| Native American | 88 | 0.3% |
| Hawaiian/Pac. Islander | 0 | 0% |
43004 Public School Race/Ethnicty Breakdown
| Race/Ethnicty | Total | Percentage |
|---|
| White | 635 | 47.39% |
| Black | 381 | 28.43% |
| Hispanic | 56 | 4.18% |
| Asian | 262 | 19.55% |
| Native American | 3 | 0.22% |
| Hawaiian/Pac. Islander | 3 | 0.22% |
43004 Educational Attainment Levels
| Highest Education Level Attained | Total | Percentage |
|---|
| Less Than 1 Year of College | 1,280 | 8.58% |
| Bachelor Degree | 4,071 | 27.29% |
| High School Diploma | 3,392 | 22.74% |
| No High School Diploma | 108 | 0.72% |
| GED or Alternate | 265 | 1.78% |
| 1 or More Years of College | 2,983 | 20% |
| Associates Degree | 948 | 6.36% |
| Masters Degree | 1,195 | 8.01% |
| Professional Degree | 520 | 3.49% |
| Doctorate Degree | 155 | 1.04% |