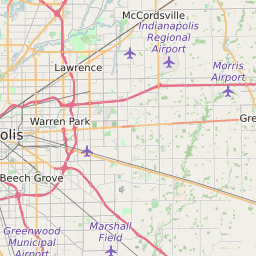
46075 can be classified socioeconomically as Middle Class class compared to other ZIP Codes in Indiana based on Median Household Income and Average Adjusted Gross Income. The majority race/ethnicity residing in 46075 is White. The majority race/ethnicity attending public schools in 46075 is White. The current unemployment level in 46075 is 3.0%.
| Population | 8,184 |
| Population Growth Rate | 34.43% |
| Population Density | 268 People per Square Mile |
| Total Households | 1,158 |
| Percentage High Income Households | 5.8% |
| Median Household Income (2021) | $100,250 |
| Average Adjusted Gross Income (2021) | $337,840 |
| Current Unemployment Rate (June 2025) | 3.0% |
| Majority Race/Ethnicty | White - 83.00% |
| Public School Majority Race/Ethnicty | White - 73.95% |
46075 Race/Ethnicty Breakdown
| Race/Ethnicty | Total | Percentage |
|---|
| White | 6,307 | 83% |
| Black | 527 | 6.94% |
| Hispanic | 393 | 5.17% |
| Asian | 372 | 4.9% |
| Native American | 0 | 0% |
| Hawaiian/Pac. Islander | 0 | 0% |
46075 Public School Race/Ethnicty Breakdown
| Race/Ethnicty | Total | Percentage |
|---|
| White | 1,252 | 79.19% |
| Black | 57 | 3.61% |
| Hispanic | 104 | 6.58% |
| Asian | 163 | 10.31% |
| Native American | 4 | 0.25% |
| Hawaiian/Pac. Islander | 1 | 0.06% |
46075 Educational Attainment Levels
| Highest Education Level Attained | Total | Percentage |
|---|
| Less Than 1 Year of College | 76 | 3.93% |
| Bachelor Degree | 506 | 26.18% |
| High School Diploma | 559 | 28.92% |
| No High School Diploma | 14 | 0.72% |
| GED or Alternate | 42 | 2.17% |
| 1 or More Years of College | 281 | 14.54% |
| Associates Degree | 215 | 11.12% |
| Masters Degree | 141 | 7.29% |
| Professional Degree | 27 | 1.4% |
| Doctorate Degree | 72 | 3.72% |