46391 can be classified socioeconomically as Middle Class class compared to other ZIP Codes in Indiana based on Median Household Income and Average Adjusted Gross Income. The majority race/ethnicity residing in 46391 is White. The majority race/ethnicity attending public schools in 46391 is White. The current unemployment level in 46391 is 4.0%.
| Population | 9,369 |
| Population Growth Rate | 0.00% |
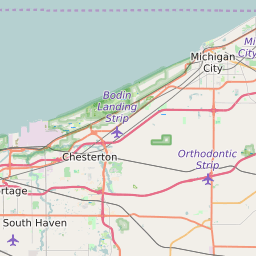
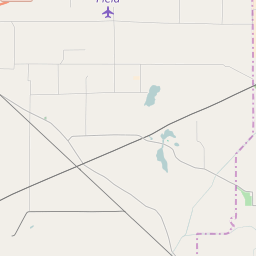
| Population Density | 246 People per Square Mile |
| Total Households | 2,246 |
| Percentage High Income Households | 1.0% |
| Median Household Income (2021) | $79,631 |
| Average Adjusted Gross Income (2021) | $323,690 |
| Current Unemployment Rate (February 2025) | 4.0% |
| Majority Race/Ethnicty | White - 80.02% |
| Public School Majority Race/Ethnicty | White - 86.85% |
46391 Race/Ethnicty Breakdown
| Race/Ethnicty | Total | Percentage |
|---|
| White | 7,535 | 80.02% |
| Black | 1,396 | 14.83% |
| Hispanic | 380 | 4.04% |
| Asian | 48 | 0.51% |
| Native American | 57 | 0.61% |
| Hawaiian/Pac. Islander | 0 | 0% |
46391 Public School Race/Ethnicty Breakdown
| Race/Ethnicty | Total | Percentage |
|---|
| White | 753 | 92.39% |
| Black | 13 | 1.6% |
| Hispanic | 44 | 5.4% |
| Asian | 4 | 0.49% |
| Native American | 1 | 0.12% |
| Hawaiian/Pac. Islander | 0 | 0% |
46391 Educational Attainment Levels
| Highest Education Level Attained | Total | Percentage |
|---|
| Less Than 1 Year of College | 637 | 10.86% |
| Bachelor Degree | 623 | 10.62% |
| High School Diploma | 1,871 | 31.9% |
| No High School Diploma | 39 | 0.66% |
| GED or Alternate | 878 | 14.97% |
| 1 or More Years of College | 954 | 16.27% |
| Associates Degree | 667 | 11.37% |
| Masters Degree | 144 | 2.46% |
| Professional Degree | 0 | 0% |
| Doctorate Degree | 52 | 0.89% |