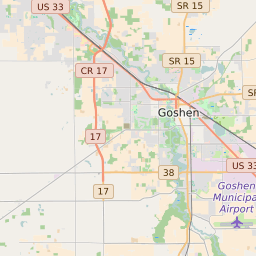
46526 can be classified socioeconomically as Lower Middle Class class compared to other ZIP Codes in Indiana based on Median Household Income and Average Adjusted Gross Income. The majority race/ethnicity residing in 46526 is White. The majority race/ethnicity attending public schools in 46526 is Hispanic. The current unemployment level in 46526 is 4.0%.
| Population | 33,339 |
| Population Growth Rate | 0.00% |
| Population Density | 504 People per Square Mile |
| Total Households | 11,355 |
| Percentage High Income Households | 2.1% |
| Median Household Income (2021) | $60,519 |
| Average Adjusted Gross Income (2021) | $567,100 |
| Current Unemployment Rate (February 2025) | 4.0% |
| Majority Race/Ethnicty | White - 76.63% |
| Public School Majority Race/Ethnicty | Hispanic - 47.20% |
46526 Race/Ethnicty Breakdown
| Race/Ethnicty | Total | Percentage |
|---|
| White | 26,891 | 76.63% |
| Black | 781 | 2.23% |
| Hispanic | 6,903 | 19.67% |
| Asian | 365 | 1.04% |
| Native American | 151 | 0.43% |
| Hawaiian/Pac. Islander | 0 | 0% |
46526 Public School Race/Ethnicty Breakdown
| Race/Ethnicty | Total | Percentage |
|---|
| White | 3,409 | 47.55% |
| Black | 168 | 2.34% |
| Hispanic | 3,501 | 48.83% |
| Asian | 83 | 1.16% |
| Native American | 9 | 0.13% |
| Hawaiian/Pac. Islander | 0 | 0% |
46526 Educational Attainment Levels
| Highest Education Level Attained | Total | Percentage |
|---|
| Less Than 1 Year of College | 1,338 | 7.74% |
| Bachelor Degree | 3,252 | 18.81% |
| High School Diploma | 6,295 | 36.42% |
| No High School Diploma | 228 | 1.32% |
| GED or Alternate | 1,139 | 6.59% |
| 1 or More Years of College | 2,373 | 13.73% |
| Associates Degree | 1,135 | 6.57% |
| Masters Degree | 1,013 | 5.86% |
| Professional Degree | 307 | 1.78% |
| Doctorate Degree | 206 | 1.19% |