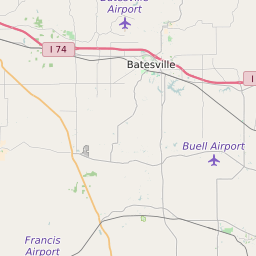
47265 can be classified socioeconomically as Lower Middle Class class compared to other ZIP Codes in Indiana based on Median Household Income and Average Adjusted Gross Income. The majority race/ethnicity residing in 47265 is White. The majority race/ethnicity attending public schools in 47265 is White. The current unemployment level in 47265 is 4.0%.
| Population | 21,520 |
| Population Growth Rate | 0.96% |
| Population Density | 114 People per Square Mile |
| Total Households | 7,844 |
| Percentage High Income Households | 0.8% |
| Median Household Income (2021) | $58,728 |
| Average Adjusted Gross Income (2021) | $483,040 |
| Current Unemployment Rate (February 2025) | 4.0% |
| Majority Race/Ethnicty | White - 94.69% |
| Public School Majority Race/Ethnicty | White - 88.56% |
47265 Race/Ethnicty Breakdown
| Race/Ethnicty | Total | Percentage |
|---|
| White | 19,595 | 94.69% |
| Black | 221 | 1.07% |
| Hispanic | 770 | 3.72% |
| Asian | 71 | 0.34% |
| Native American | 37 | 0.18% |
| Hawaiian/Pac. Islander | 0 | 0% |
47265 Public School Race/Ethnicty Breakdown
| Race/Ethnicty | Total | Percentage |
|---|
| White | 2,780 | 90.7% |
| Black | 13 | 0.42% |
| Hispanic | 257 | 8.38% |
| Asian | 3 | 0.1% |
| Native American | 6 | 0.2% |
| Hawaiian/Pac. Islander | 6 | 0.2% |
47265 Educational Attainment Levels
| Highest Education Level Attained | Total | Percentage |
|---|
| Less Than 1 Year of College | 1,132 | 9.77% |
| Bachelor Degree | 857 | 7.4% |
| High School Diploma | 4,869 | 42.02% |
| No High School Diploma | 273 | 2.36% |
| GED or Alternate | 1,258 | 10.86% |
| 1 or More Years of College | 1,872 | 16.15% |
| Associates Degree | 942 | 8.13% |
| Masters Degree | 338 | 2.92% |
| Professional Degree | 28 | 0.24% |
| Doctorate Degree | 19 | 0.16% |