50056 can be classified socioeconomically as Lower Middle Class class compared to other ZIP Codes in Iowa based on Median Household Income and Average Adjusted Gross Income. The majority race/ethnicity residing in 50056 is White. The majority race/ethnicity attending public schools in 50056 is White. The current unemployment level in 50056 is 3.1%.
| Population | 1,190 |
| Population Growth Rate | 0.00% |
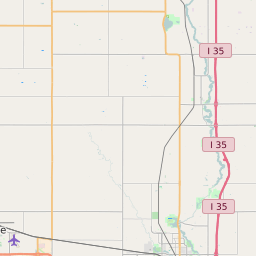
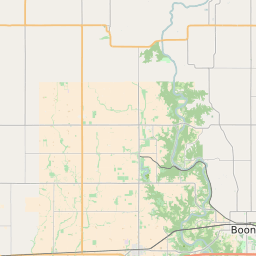
| Population Density | 21 People per Square Mile |
| Total Households | 556 |
| Median Household Income (2021) | $68,077 |
| Average Adjusted Gross Income (2021) | $330,770 |
| Current Unemployment Rate (January 2025) | 3.1% |
| Majority Race/Ethnicty | White - 96.41% |
| Public School Majority Race/Ethnicty | White - 92.50% |
50056 Race/Ethnicty Breakdown
| Race/Ethnicty | Total | Percentage |
|---|
| White | 1,156 | 96.41% |
| Black | 0 | 0% |
| Hispanic | 37 | 3.09% |
| Asian | 6 | 0.5% |
| Native American | 0 | 0% |
| Hawaiian/Pac. Islander | 0 | 0% |
50056 Public School Race/Ethnicty Breakdown
| Race/Ethnicty | Total | Percentage |
|---|
| White | 222 | 94.47% |
| Black | 0 | 0% |
| Hispanic | 12 | 5.11% |
| Asian | 1 | 0.43% |
| Native American | 0 | 0% |
| Hawaiian/Pac. Islander | 0 | 0% |
50056 Educational Attainment Levels
| Highest Education Level Attained | Total | Percentage |
|---|
| Less Than 1 Year of College | 76 | 8.67% |
| Bachelor Degree | 158 | 18.02% |
| High School Diploma | 290 | 33.07% |
| No High School Diploma | 8 | 0.91% |
| GED or Alternate | 30 | 3.42% |
| 1 or More Years of College | 162 | 18.47% |
| Associates Degree | 97 | 11.06% |
| Masters Degree | 21 | 2.39% |
| Professional Degree | 12 | 1.37% |
| Doctorate Degree | 23 | 2.62% |