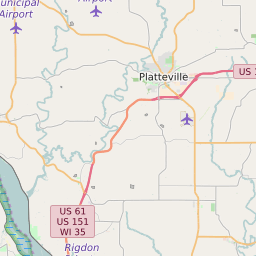
53566 can be classified socioeconomically as Lower Middle Class class compared to other ZIP Codes in Wisconsin based on Median Household Income and Average Adjusted Gross Income. The majority race/ethnicity residing in 53566 is White. The majority race/ethnicity attending public schools in 53566 is White. The current unemployment level in 53566 is 2.9%.
| Population | 15,037 |
| Population Growth Rate | 0.00% |
| Population Density | 102 People per Square Mile |
| Total Households | 6,441 |
| Percentage High Income Households | 2.4% |
| Median Household Income (2021) | $63,062 |
| Average Adjusted Gross Income (2021) | $665,660 |
| Current Unemployment Rate (February 2025) | 2.9% |
| Majority Race/Ethnicty | White - 94.31% |
| Public School Majority Race/Ethnicty | White - 83.90% |
53566 Race/Ethnicty Breakdown
| Race/Ethnicty | Total | Percentage |
|---|
| White | 14,308 | 94.31% |
| Black | 66 | 0.44% |
| Hispanic | 726 | 4.79% |
| Asian | 59 | 0.39% |
| Native American | 12 | 0.08% |
| Hawaiian/Pac. Islander | 0 | 0% |
53566 Public School Race/Ethnicty Breakdown
| Race/Ethnicty | Total | Percentage |
|---|
| White | 1,871 | 86.42% |
| Black | 19 | 0.88% |
| Hispanic | 257 | 11.87% |
| Asian | 17 | 0.79% |
| Native American | 1 | 0.05% |
| Hawaiian/Pac. Islander | 0 | 0% |
53566 Educational Attainment Levels
| Highest Education Level Attained | Total | Percentage |
|---|
| Less Than 1 Year of College | 928 | 9.5% |
| Bachelor Degree | 1,140 | 11.66% |
| High School Diploma | 3,829 | 39.18% |
| No High School Diploma | 184 | 1.88% |
| GED or Alternate | 599 | 6.13% |
| 1 or More Years of College | 1,543 | 15.79% |
| Associates Degree | 840 | 8.6% |
| Masters Degree | 468 | 4.79% |
| Professional Degree | 163 | 1.67% |
| Doctorate Degree | 79 | 0.81% |