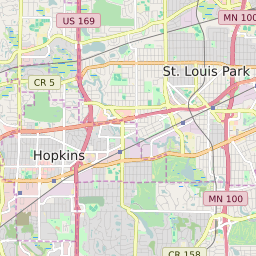
55305 can be classified socioeconomically as Middle Class class compared to other ZIP Codes in Minnesota based on Median Household Income and Average Adjusted Gross Income. The majority race/ethnicity residing in 55305 is White. The majority race/ethnicity attending public schools in 55305 is White. The current unemployment level in 55305 is 2.9%.
| Population | 21,256 |
| Population Growth Rate | 8.39% |
| Population Density | 2,233 People per Square Mile |
| Total Households | 9,017 |
| Percentage High Income Households | 9.4% |
| Median Household Income (2021) | $95,701 |
| Average Adjusted Gross Income (2021) | $613,630 |
| Current Unemployment Rate (January 2025) | 2.9% |
| Majority Race/Ethnicty | White - 80.51% |
| Public School Majority Race/Ethnicty | White - 49.89% |
55305 Race/Ethnicty Breakdown
| Race/Ethnicty | Total | Percentage |
|---|
| White | 17,237 | 80.51% |
| Black | 1,384 | 6.46% |
| Hispanic | 540 | 2.52% |
| Asian | 2,235 | 10.44% |
| Native American | 13 | 0.06% |
| Hawaiian/Pac. Islander | 0 | 0% |
55305 Public School Race/Ethnicty Breakdown
| Race/Ethnicty | Total | Percentage |
|---|
| White | 2,263 | 54.49% |
| Black | 1,076 | 25.91% |
| Hispanic | 509 | 12.26% |
| Asian | 284 | 6.84% |
| Native American | 18 | 0.43% |
| Hawaiian/Pac. Islander | 3 | 0.07% |
55305 Educational Attainment Levels
| Highest Education Level Attained | Total | Percentage |
|---|
| Less Than 1 Year of College | 617 | 4.53% |
| Bachelor Degree | 4,990 | 36.66% |
| High School Diploma | 2,016 | 14.81% |
| No High School Diploma | 81 | 0.6% |
| GED or Alternate | 148 | 1.09% |
| 1 or More Years of College | 2,112 | 15.51% |
| Associates Degree | 1,081 | 7.94% |
| Masters Degree | 1,716 | 12.61% |
| Professional Degree | 658 | 4.83% |
| Doctorate Degree | 194 | 1.43% |