59003 can be classified socioeconomically as Lower Middle Class class compared to other ZIP Codes in Montana based on Median Household Income and Average Adjusted Gross Income. The majority race/ethnicity residing in 59003 is Native American. The majority race/ethnicity attending public schools in 59003 is Native American. The current unemployment level in 59003 is 3.0%.
| Population | 1,125 |
| Population Growth Rate | -16.07% |
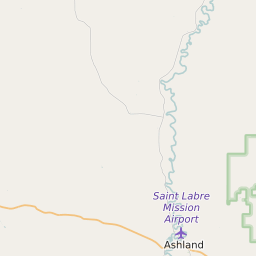
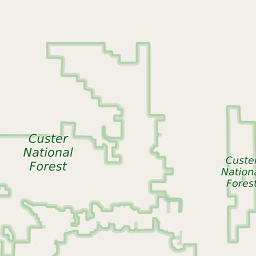
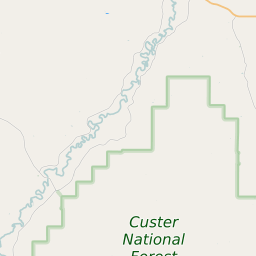
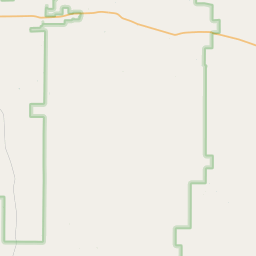
| Population Density | 31 People per Square Mile |
| Total Households | 419 |
| Percentage High Income Households | 1.9% |
| Median Household Income (2021) | $41,902 |
| Average Adjusted Gross Income (2021) | $152,230 |
| Current Unemployment Rate (February 2025) | 3.0% |
| Majority Race/Ethnicty | Native American - 51.05% |
| Public School Majority Race/Ethnicty | Native American - 92.54% |
59003 Race/Ethnicty Breakdown
| Race/Ethnicty | Total | Percentage |
|---|
| White | 464 | 44.36% |
| Black | 14 | 1.34% |
| Hispanic | 22 | 2.1% |
| Asian | 12 | 1.15% |
| Native American | 534 | 51.05% |
| Hawaiian/Pac. Islander | 0 | 0% |
59003 Public School Race/Ethnicty Breakdown
| Race/Ethnicty | Total | Percentage |
|---|
| White | 4 | 6.06% |
| Black | 0 | 0% |
| Hispanic | 0 | 0% |
| Asian | 0 | 0% |
| Native American | 62 | 93.94% |
| Hawaiian/Pac. Islander | 0 | 0% |
59003 Educational Attainment Levels
| Highest Education Level Attained | Total | Percentage |
|---|
| Less Than 1 Year of College | 38 | 6.16% |
| Bachelor Degree | 94 | 15.24% |
| High School Diploma | 201 | 32.58% |
| No High School Diploma | 9 | 1.46% |
| GED or Alternate | 25 | 4.05% |
| 1 or More Years of College | 160 | 25.93% |
| Associates Degree | 28 | 4.54% |
| Masters Degree | 40 | 6.48% |
| Professional Degree | 12 | 1.94% |
| Doctorate Degree | 10 | 1.62% |