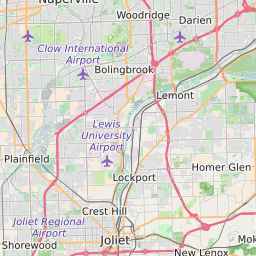
60440 can be classified socioeconomically as Middle Class class compared to other ZIP Codes in Illinois based on Median Household Income and Average Adjusted Gross Income. The majority race/ethnicity residing in 60440 is White. The majority race/ethnicity attending public schools in 60440 is Hispanic. The current unemployment level in 60440 is 4.3%.
| Population | 51,412 |
| Population Growth Rate | 0.00% |
| Population Density | 3,201 People per Square Mile |
| Total Households | 16,027 |
| Percentage High Income Households | 3.8% |
| Median Household Income (2021) | $83,292 |
| Average Adjusted Gross Income (2021) | $319,180 |
| Current Unemployment Rate (February 2025) | 4.3% |
| Majority Race/Ethnicty | White - 43.60% |
| Public School Majority Race/Ethnicty | Hispanic - 46.02% |
60440 Race/Ethnicty Breakdown
| Race/Ethnicty | Total | Percentage |
|---|
| White | 23,913 | 43.6% |
| Black | 10,493 | 19.13% |
| Hispanic | 15,701 | 28.63% |
| Asian | 4,526 | 8.25% |
| Native American | 208 | 0.38% |
| Hawaiian/Pac. Islander | 3 | 0.01% |
60440 Public School Race/Ethnicty Breakdown
| Race/Ethnicty | Total | Percentage |
|---|
| White | 1,555 | 17.86% |
| Black | 2,273 | 26.1% |
| Hispanic | 4,217 | 48.43% |
| Asian | 631 | 7.25% |
| Native American | 13 | 0.15% |
| Hawaiian/Pac. Islander | 19 | 0.22% |
60440 Educational Attainment Levels
| Highest Education Level Attained | Total | Percentage |
|---|
| Less Than 1 Year of College | 2,045 | 7.04% |
| Bachelor Degree | 6,650 | 22.89% |
| High School Diploma | 8,111 | 27.92% |
| No High School Diploma | 981 | 3.38% |
| GED or Alternate | 1,052 | 3.62% |
| 1 or More Years of College | 4,865 | 16.74% |
| Associates Degree | 2,581 | 8.88% |
| Masters Degree | 2,156 | 7.42% |
| Professional Degree | 351 | 1.21% |
| Doctorate Degree | 264 | 0.91% |