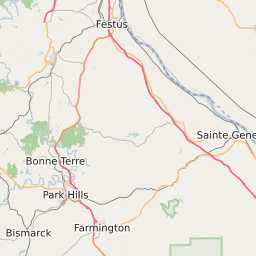
63664 can be classified socioeconomically as Lower Middle Class class compared to other ZIP Codes in Missouri based on Median Household Income and Average Adjusted Gross Income. The majority race/ethnicity residing in 63664 is White. The majority race/ethnicity attending public schools in 63664 is White. The current unemployment level in 63664 is 3.8%.
| Population | 9,039 |
| Population Growth Rate | 0.02% |
| Population Density | 35 People per Square Mile |
| Total Households | 3,217 |
| Percentage High Income Households | 0.8% |
| Median Household Income (2021) | $52,926 |
| Average Adjusted Gross Income (2021) | $380,050 |
| Current Unemployment Rate (June 2025) | 3.8% |
| Majority Race/Ethnicty | White - 97.96% |
| Public School Majority Race/Ethnicty | White - 95.68% |
63664 Race/Ethnicty Breakdown
| Race/Ethnicty | Total | Percentage |
|---|
| White | 8,374 | 97.64% |
| Black | 32 | 0.37% |
| Hispanic | 132 | 1.54% |
| Asian | 6 | 0.07% |
| Native American | 4 | 0.05% |
| Hawaiian/Pac. Islander | 28 | 0.33% |
63664 Public School Race/Ethnicty Breakdown
| Race/Ethnicty | Total | Percentage |
|---|
| White | 1,906 | 97.89% |
| Black | 16 | 0.82% |
| Hispanic | 18 | 0.92% |
| Asian | 5 | 0.26% |
| Native American | 2 | 0.1% |
| Hawaiian/Pac. Islander | 0 | 0% |
63664 Educational Attainment Levels
| Highest Education Level Attained | Total | Percentage |
|---|
| Less Than 1 Year of College | 418 | 10.06% |
| Bachelor Degree | 372 | 8.95% |
| High School Diploma | 1,485 | 35.73% |
| No High School Diploma | 134 | 3.22% |
| GED or Alternate | 351 | 8.45% |
| 1 or More Years of College | 667 | 16.05% |
| Associates Degree | 326 | 7.84% |
| Masters Degree | 247 | 5.94% |
| Professional Degree | 131 | 3.15% |
| Doctorate Degree | 25 | 0.6% |