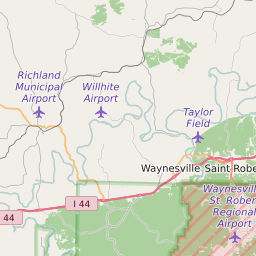
65663 can be classified socioeconomically as Lower Middle Class class compared to other ZIP Codes in Missouri based on Median Household Income and Average Adjusted Gross Income. The majority race/ethnicity residing in 65663 is White. The majority race/ethnicity attending public schools in 65663 is White. The current unemployment level in 65663 is 3.2%.
| Population | 2,722 |
| Population Growth Rate | -18.07% |
| Population Density | 24 People per Square Mile |
| Total Households | 886 |
| Percentage High Income Households | 1.0% |
| Median Household Income (2021) | $54,259 |
| Average Adjusted Gross Income (2021) | $169,000 |
| Current Unemployment Rate (February 2025) | 3.2% |
| Majority Race/Ethnicty | White - 98.08% |
| Public School Majority Race/Ethnicty | White - 94.49% |
65663 Race/Ethnicty Breakdown
| Race/Ethnicty | Total | Percentage |
|---|
| White | 2,250 | 98.08% |
| Black | 0 | 0% |
| Hispanic | 8 | 0.35% |
| Asian | 33 | 1.44% |
| Native American | 3 | 0.13% |
| Hawaiian/Pac. Islander | 0 | 0% |
65663 Public School Race/Ethnicty Breakdown
| Race/Ethnicty | Total | Percentage |
|---|
| White | 240 | 97.96% |
| Black | 0 | 0% |
| Hispanic | 5 | 2.04% |
| Asian | 0 | 0% |
| Native American | 0 | 0% |
| Hawaiian/Pac. Islander | 0 | 0% |
65663 Educational Attainment Levels
| Highest Education Level Attained | Total | Percentage |
|---|
| Less Than 1 Year of College | 90 | 7.1% |
| Bachelor Degree | 205 | 16.18% |
| High School Diploma | 632 | 49.88% |
| No High School Diploma | 13 | 1.03% |
| GED or Alternate | 46 | 3.63% |
| 1 or More Years of College | 150 | 11.84% |
| Associates Degree | 58 | 4.58% |
| Masters Degree | 26 | 2.05% |
| Professional Degree | 41 | 3.24% |
| Doctorate Degree | 6 | 0.47% |