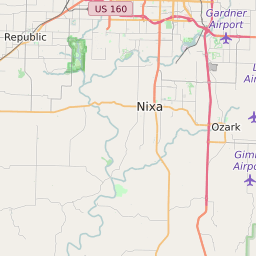
65757 can be classified socioeconomically as Lower Middle Class class compared to other ZIP Codes in Missouri based on Median Household Income and Average Adjusted Gross Income. The majority race/ethnicity residing in 65757 is White. The majority race/ethnicity attending public schools in 65757 is White. The current unemployment level in 65757 is 3.2%.
| Population | 7,380 |
| Population Growth Rate | 3.21% |
| Population Density | 88 People per Square Mile |
| Total Households | 2,633 |
| Percentage High Income Households | 2.5% |
| Median Household Income (2021) | $66,569 |
| Average Adjusted Gross Income (2021) | $784,440 |
| Current Unemployment Rate (February 2025) | 3.2% |
| Majority Race/Ethnicty | White - 96.92% |
| Public School Majority Race/Ethnicty | White - 92.63% |
65757 Race/Ethnicty Breakdown
| Race/Ethnicty | Total | Percentage |
|---|
| White | 6,769 | 96.92% |
| Black | 31 | 0.44% |
| Hispanic | 45 | 0.64% |
| Asian | 107 | 1.53% |
| Native American | 32 | 0.46% |
| Hawaiian/Pac. Islander | 0 | 0% |
65757 Public School Race/Ethnicty Breakdown
| Race/Ethnicty | Total | Percentage |
|---|
| White | 1,206 | 97.65% |
| Black | 12 | 0.97% |
| Hispanic | 8 | 0.65% |
| Asian | 4 | 0.32% |
| Native American | 5 | 0.4% |
| Hawaiian/Pac. Islander | 0 | 0% |
65757 Educational Attainment Levels
| Highest Education Level Attained | Total | Percentage |
|---|
| Less Than 1 Year of College | 284 | 6.78% |
| Bachelor Degree | 745 | 17.8% |
| High School Diploma | 1,481 | 35.38% |
| No High School Diploma | 84 | 2.01% |
| GED or Alternate | 301 | 7.19% |
| 1 or More Years of College | 714 | 17.06% |
| Associates Degree | 332 | 7.93% |
| Masters Degree | 165 | 3.94% |
| Professional Degree | 61 | 1.46% |
| Doctorate Degree | 19 | 0.45% |