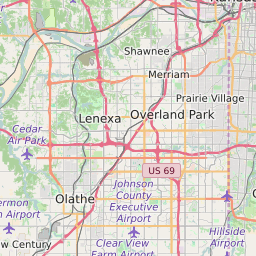
66215 can be classified socioeconomically as Middle Class class compared to other ZIP Codes in Kansas based on Median Household Income and Average Adjusted Gross Income. The majority race/ethnicity residing in 66215 is White. The majority race/ethnicity attending public schools in 66215 is White. The current unemployment level in 66215 is 3.4%.
| Population | 26,001 |
| Population Growth Rate | 0.00% |
| Population Density | 3,220 People per Square Mile |
| Total Households | 10,338 |
| Percentage High Income Households | 5.0% |
| Median Household Income (2021) | $80,438 |
| Average Adjusted Gross Income (2021) | $377,320 |
| Current Unemployment Rate (January 2025) | 3.4% |
| Majority Race/Ethnicty | White - 79.04% |
| Public School Majority Race/Ethnicty | White - 55.74% |
66215 Race/Ethnicty Breakdown
| Race/Ethnicty | Total | Percentage |
|---|
| White | 20,926 | 79.04% |
| Black | 1,807 | 6.83% |
| Hispanic | 2,773 | 10.47% |
| Asian | 773 | 2.92% |
| Native American | 197 | 0.74% |
| Hawaiian/Pac. Islander | 0 | 0% |
66215 Public School Race/Ethnicty Breakdown
| Race/Ethnicty | Total | Percentage |
|---|
| White | 782 | 59.79% |
| Black | 203 | 15.52% |
| Hispanic | 279 | 21.33% |
| Asian | 36 | 2.75% |
| Native American | 5 | 0.38% |
| Hawaiian/Pac. Islander | 3 | 0.23% |
66215 Educational Attainment Levels
| Highest Education Level Attained | Total | Percentage |
|---|
| Less Than 1 Year of College | 1,145 | 6.95% |
| Bachelor Degree | 4,985 | 30.25% |
| High School Diploma | 2,677 | 16.24% |
| No High School Diploma | 122 | 0.74% |
| GED or Alternate | 238 | 1.44% |
| 1 or More Years of College | 3,217 | 19.52% |
| Associates Degree | 1,364 | 8.28% |
| Masters Degree | 2,161 | 13.11% |
| Professional Degree | 365 | 2.21% |
| Doctorate Degree | 208 | 1.26% |