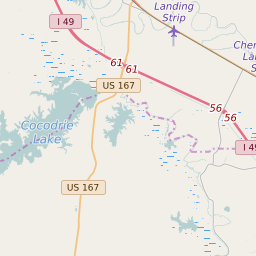
71350 can be classified socioeconomically as Lower Middle Class class compared to other ZIP Codes in Louisiana based on Median Household Income and Average Adjusted Gross Income. The majority race/ethnicity residing in 71350 is White. The majority race/ethnicity attending public schools in 71350 is White. The current unemployment level in 71350 is 4.4%.
| Population | 4,510 |
| Population Growth Rate | -17.25% |
| Population Density | 124 People per Square Mile |
| Total Households | 1,526 |
| Percentage High Income Households | 0.8% |
| Median Household Income (2021) | $34,967 |
| Average Adjusted Gross Income (2021) | $321,500 |
| Current Unemployment Rate (May 2025) | 4.4% |
| Majority Race/Ethnicty | White - 65.75% |
| Public School Majority Race/Ethnicty | White - 63.73% |
71350 Race/Ethnicty Breakdown
| Race/Ethnicty | Total | Percentage |
|---|
| White | 2,524 | 65.75% |
| Black | 1,101 | 28.68% |
| Hispanic | 39 | 1.02% |
| Asian | 147 | 3.83% |
| Native American | 28 | 0.73% |
| Hawaiian/Pac. Islander | 0 | 0% |
71350 Public School Race/Ethnicty Breakdown
| Race/Ethnicty | Total | Percentage |
|---|
| White | 601 | 64.9% |
| Black | 260 | 28.08% |
| Hispanic | 20 | 2.16% |
| Asian | 19 | 2.05% |
| Native American | 25 | 2.7% |
| Hawaiian/Pac. Islander | 1 | 0.11% |
71350 Educational Attainment Levels
| Highest Education Level Attained | Total | Percentage |
|---|
| Less Than 1 Year of College | 137 | 7.02% |
| Bachelor Degree | 139 | 7.12% |
| High School Diploma | 775 | 39.7% |
| No High School Diploma | 89 | 4.56% |
| GED or Alternate | 162 | 8.3% |
| 1 or More Years of College | 419 | 21.47% |
| Associates Degree | 178 | 9.12% |
| Masters Degree | 44 | 2.25% |
| Professional Degree | 9 | 0.46% |
| Doctorate Degree | 0 | 0% |