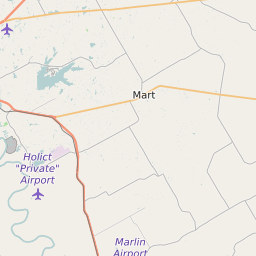
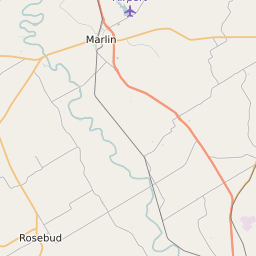
76661 can be classified socioeconomically as Lower Class class compared to other ZIP Codes in Texas based on Median Household Income and Average Adjusted Gross Income. The majority race/ethnicity residing in 76661 is White. The majority race/ethnicity attending public schools in 76661 is African American. The current unemployment level in 76661 is 3.7%.
| Population | 7,118 |
| Population Growth Rate | -8.88% |
| Population Density | 44 People per Square Mile |
| Total Households | 2,477 |
| Median Household Income (2021) | $28,283 |
| Average Adjusted Gross Income (2021) | $429,600 |
| Current Unemployment Rate (February 2025) | 3.7% |
| Majority Race/Ethnicty | White - 40.76% |
| Public School Majority Race/Ethnicty | African American - 55.96% |
76661 Race/Ethnicty Breakdown
| Race/Ethnicty | Total | Percentage |
|---|
| White | 3,565 | 40.76% |
| Black | 3,099 | 35.43% |
| Hispanic | 1,821 | 20.82% |
| Asian | 215 | 2.46% |
| Native American | 46 | 0.53% |
| Hawaiian/Pac. Islander | 0 | 0% |
76661 Public School Race/Ethnicty Breakdown
| Race/Ethnicty | Total | Percentage |
|---|
| White | 59 | 6.88% |
| Black | 493 | 57.53% |
| Hispanic | 301 | 35.12% |
| Asian | 4 | 0.47% |
| Native American | 0 | 0% |
| Hawaiian/Pac. Islander | 0 | 0% |
76661 Educational Attainment Levels
| Highest Education Level Attained | Total | Percentage |
|---|
| Less Than 1 Year of College | 386 | 9.08% |
| Bachelor Degree | 336 | 7.9% |
| High School Diploma | 1,568 | 36.88% |
| No High School Diploma | 100 | 2.35% |
| GED or Alternate | 682 | 16.04% |
| 1 or More Years of College | 783 | 18.41% |
| Associates Degree | 219 | 5.15% |
| Masters Degree | 131 | 3.08% |
| Professional Degree | 29 | 0.68% |
| Doctorate Degree | 18 | 0.42% |