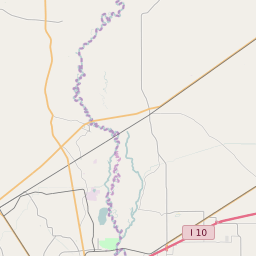
77659 can be classified socioeconomically as Middle Class class compared to other ZIP Codes in Texas based on Median Household Income and Average Adjusted Gross Income. The majority race/ethnicity residing in 77659 is White. The majority race/ethnicity attending public schools in 77659 is White. The current unemployment level in 77659 is 3.7%.
| Population | 6,305 |
| Population Growth Rate | 31.94% |
| Population Density | 52 People per Square Mile |
| Total Households | 1,823 |
| Percentage High Income Households | 4.3% |
| Median Household Income (2021) | $78,750 |
| Average Adjusted Gross Income (2021) | $430,490 |
| Current Unemployment Rate (February 2025) | 3.7% |
| Majority Race/Ethnicty | White - 86.14% |
| Public School Majority Race/Ethnicty | White - 77.23% |
77659 Race/Ethnicty Breakdown
| Race/Ethnicty | Total | Percentage |
|---|
| White | 5,602 | 86.14% |
| Black | 234 | 3.6% |
| Hispanic | 568 | 8.73% |
| Asian | 99 | 1.52% |
| Native American | 0 | 0% |
| Hawaiian/Pac. Islander | 0 | 0% |
77659 Public School Race/Ethnicty Breakdown
| Race/Ethnicty | Total | Percentage |
|---|
| White | 1,533 | 79.02% |
| Black | 202 | 10.41% |
| Hispanic | 182 | 9.38% |
| Asian | 19 | 0.98% |
| Native American | 3 | 0.15% |
| Hawaiian/Pac. Islander | 1 | 0.05% |
77659 Educational Attainment Levels
| Highest Education Level Attained | Total | Percentage |
|---|
| Less Than 1 Year of College | 252 | 8.4% |
| Bachelor Degree | 401 | 13.36% |
| High School Diploma | 1,016 | 33.86% |
| No High School Diploma | 9 | 0.3% |
| GED or Alternate | 135 | 4.5% |
| 1 or More Years of College | 753 | 25.09% |
| Associates Degree | 298 | 9.93% |
| Masters Degree | 108 | 3.6% |
| Professional Degree | 15 | 0.5% |
| Doctorate Degree | 14 | 0.47% |