77879 can be classified socioeconomically as Lower Middle Class class compared to other ZIP Codes in Texas based on Median Household Income and Average Adjusted Gross Income. The majority race/ethnicity residing in 77879 is White. The majority race/ethnicity attending public schools in 77879 is White. The current unemployment level in 77879 is 3.7%.
| Population | 4,876 |
| Population Growth Rate | -1.69% |
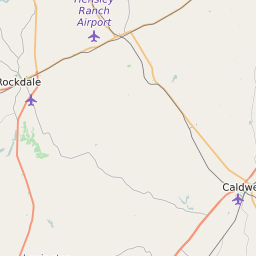
| Population Density | 22 People per Square Mile |
| Total Households | 1,829 |
| Percentage High Income Households | 1.7% |
| Median Household Income (2021) | $60,807 |
| Average Adjusted Gross Income (2021) | $328,670 |
| Current Unemployment Rate (June 2025) | 3.7% |
| Majority Race/Ethnicty | White - 67.54% |
| Public School Majority Race/Ethnicty | White - 43.20% |
77879 Race/Ethnicty Breakdown
| Race/Ethnicty | Total | Percentage |
|---|
| White | 3,730 | 67.54% |
| Black | 868 | 15.72% |
| Hispanic | 839 | 15.19% |
| Asian | 0 | 0% |
| Native American | 86 | 1.56% |
| Hawaiian/Pac. Islander | 0 | 0% |
77879 Public School Race/Ethnicty Breakdown
| Race/Ethnicty | Total | Percentage |
|---|
| White | 435 | 45.08% |
| Black | 211 | 21.87% |
| Hispanic | 313 | 32.44% |
| Asian | 4 | 0.41% |
| Native American | 2 | 0.21% |
| Hawaiian/Pac. Islander | 0 | 0% |
77879 Educational Attainment Levels
| Highest Education Level Attained | Total | Percentage |
|---|
| Less Than 1 Year of College | 209 | 8.03% |
| Bachelor Degree | 277 | 10.64% |
| High School Diploma | 1,167 | 44.82% |
| No High School Diploma | 56 | 2.15% |
| GED or Alternate | 216 | 8.29% |
| 1 or More Years of College | 460 | 17.67% |
| Associates Degree | 162 | 6.22% |
| Masters Degree | 37 | 1.42% |
| Professional Degree | 7 | 0.27% |
| Doctorate Degree | 13 | 0.5% |