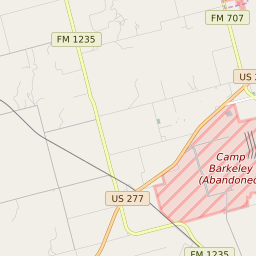
79607 can be classified socioeconomically as Lower Middle Class class compared to other ZIP Codes in Texas based on Median Household Income and Average Adjusted Gross Income. The majority race/ethnicity residing in 79607 is White. The majority race/ethnicity attending public schools in 79607 is White. The current unemployment level in 79607 is 3.7%.
| Population | 3,699 |
| Population Growth Rate | 17.50% |
| Population Density | 450 People per Square Mile |
| Total Households | 545 |
| Percentage High Income Households | 2.9% |
| Median Household Income (2021) | $54,816 |
| Average Adjusted Gross Income (2021) | $150,250 |
| Current Unemployment Rate (February 2025) | 3.7% |
| Majority Race/Ethnicty | White - 64.85% |
| Public School Majority Race/Ethnicty | White - 46.55% |
79607 Race/Ethnicty Breakdown
| Race/Ethnicty | Total | Percentage |
|---|
| White | 2,664 | 64.85% |
| Black | 568 | 13.83% |
| Hispanic | 774 | 18.84% |
| Asian | 102 | 2.48% |
| Native American | 0 | 0% |
| Hawaiian/Pac. Islander | 0 | 0% |
79607 Public School Race/Ethnicty Breakdown
| Race/Ethnicty | Total | Percentage |
|---|
| White | 216 | 50.12% |
| Black | 55 | 12.76% |
| Hispanic | 145 | 33.64% |
| Asian | 12 | 2.78% |
| Native American | 1 | 0.23% |
| Hawaiian/Pac. Islander | 2 | 0.46% |
79607 Educational Attainment Levels
| Highest Education Level Attained | Total | Percentage |
|---|
| Less Than 1 Year of College | 132 | 14.19% |
| Bachelor Degree | 127 | 13.66% |
| High School Diploma | 77 | 8.28% |
| No High School Diploma | 0 | 0% |
| GED or Alternate | 91 | 9.78% |
| 1 or More Years of College | 193 | 20.75% |
| Associates Degree | 217 | 23.33% |
| Masters Degree | 79 | 8.49% |
| Professional Degree | 7 | 0.75% |
| Doctorate Degree | 7 | 0.75% |