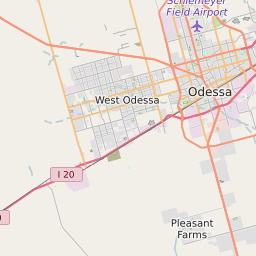
79764 can be classified socioeconomically as Lower Middle Class class compared to other ZIP Codes in Texas based on Median Household Income and Average Adjusted Gross Income. The majority race/ethnicity residing in 79764 is White. The majority race/ethnicity attending public schools in 79764 is Hispanic. The current unemployment level in 79764 is 3.7%.
| Population | 25,907 |
| Population Growth Rate | 17.04% |
| Population Density | 403 People per Square Mile |
| Total Households | 6,802 |
| Percentage High Income Households | 2.7% |
| Median Household Income (2021) | $73,276 |
| Average Adjusted Gross Income (2021) | $355,270 |
| Current Unemployment Rate (February 2025) | 3.7% |
| Majority Race/Ethnicty | White - 51.62% |
| Public School Majority Race/Ethnicty | Hispanic - 87.05% |
79764 Race/Ethnicty Breakdown
| Race/Ethnicty | Total | Percentage |
|---|
| White | 17,798 | 51.57% |
| Black | 644 | 1.87% |
| Hispanic | 16,039 | 46.47% |
| Asian | 0 | 0% |
| Native American | 0 | 0% |
| Hawaiian/Pac. Islander | 33 | 0.1% |
79764 Public School Race/Ethnicty Breakdown
| Race/Ethnicty | Total | Percentage |
|---|
| White | 193 | 9.18% |
| Black | 45 | 2.14% |
| Hispanic | 1,848 | 87.92% |
| Asian | 10 | 0.48% |
| Native American | 2 | 0.1% |
| Hawaiian/Pac. Islander | 4 | 0.19% |
79764 Educational Attainment Levels
| Highest Education Level Attained | Total | Percentage |
|---|
| Less Than 1 Year of College | 1,085 | 12.77% |
| Bachelor Degree | 638 | 7.51% |
| High School Diploma | 2,557 | 30.1% |
| No High School Diploma | 421 | 4.96% |
| GED or Alternate | 1,110 | 13.06% |
| 1 or More Years of College | 1,968 | 23.16% |
| Associates Degree | 491 | 5.78% |
| Masters Degree | 174 | 2.05% |
| Professional Degree | 23 | 0.27% |
| Doctorate Degree | 29 | 0.34% |