89135 can be classified socioeconomically as Middle Class class compared to other ZIP Codes in Nevada based on Median Household Income and Average Adjusted Gross Income. The majority race/ethnicity residing in 89135 is White. The majority race/ethnicity attending public schools in 89135 is White. The current unemployment level in 89135 is 5.0%.
| Population | 30,876 |
| Population Growth Rate | 13.13% |
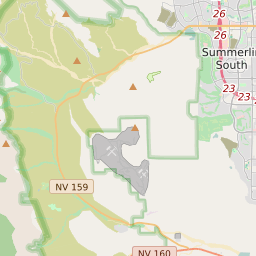
| Population Density | 2,502 People per Square Mile |
| Total Households | 10,251 |
| Percentage High Income Households | 13.8% |
| Median Household Income (2021) | $105,087 |
| Average Adjusted Gross Income (2021) | $1,950,330 |
| Current Unemployment Rate (June 2025) | 5.0% |
| Majority Race/Ethnicty | White - 70.99% |
| Public School Majority Race/Ethnicty | White - 43.31% |
89135 Race/Ethnicty Breakdown
| Race/Ethnicty | Total | Percentage |
|---|
| White | 21,141 | 70.5% |
| Black | 1,032 | 3.44% |
| Hispanic | 3,862 | 12.88% |
| Asian | 3,700 | 12.34% |
| Native American | 45 | 0.15% |
| Hawaiian/Pac. Islander | 208 | 0.69% |
89135 Public School Race/Ethnicty Breakdown
| Race/Ethnicty | Total | Percentage |
|---|
| White | 1,233 | 47.51% |
| Black | 193 | 7.44% |
| Hispanic | 625 | 24.08% |
| Asian | 509 | 19.61% |
| Native American | 5 | 0.19% |
| Hawaiian/Pac. Islander | 30 | 1.16% |
89135 Educational Attainment Levels
| Highest Education Level Attained | Total | Percentage |
|---|
| Less Than 1 Year of College | 954 | 5.48% |
| Bachelor Degree | 4,607 | 26.45% |
| High School Diploma | 3,273 | 18.79% |
| No High School Diploma | 180 | 1.03% |
| GED or Alternate | 490 | 2.81% |
| 1 or More Years of College | 3,089 | 17.73% |
| Associates Degree | 1,249 | 7.17% |
| Masters Degree | 2,144 | 12.31% |
| Professional Degree | 1,088 | 6.25% |
| Doctorate Degree | 345 | 1.98% |