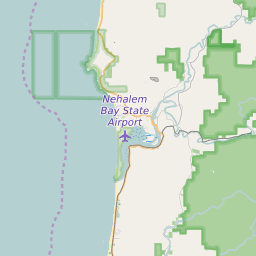
97136 can be classified socioeconomically as Lower Middle Class class compared to other ZIP Codes in Oregon based on Median Household Income and Average Adjusted Gross Income. The majority race/ethnicity residing in 97136 is White. The majority race/ethnicity attending public schools in 97136 is White. The current unemployment level in 97136 is 3.8%.
| Population | 2,170 |
| Population Growth Rate | 29.83% |
| Population Density | 131 People per Square Mile |
| Total Households | 794 |
| Percentage High Income Households | 3.5% |
| Median Household Income (2021) | $57,549 |
| Average Adjusted Gross Income (2021) | $449,280 |
| Current Unemployment Rate (January 2025) | 3.8% |
| Majority Race/Ethnicty | White - 98.28% |
| Public School Majority Race/Ethnicty | White - 75.17% |
97136 Race/Ethnicty Breakdown
| Race/Ethnicty | Total | Percentage |
|---|
| White | 2,115 | 98.28% |
| Black | 7 | 0.33% |
| Hispanic | 12 | 0.56% |
| Asian | 14 | 0.65% |
| Native American | 4 | 0.19% |
| Hawaiian/Pac. Islander | 0 | 0% |
97136 Public School Race/Ethnicty Breakdown
| Race/Ethnicty | Total | Percentage |
|---|
| White | 336 | 79.62% |
| Black | 2 | 0.47% |
| Hispanic | 72 | 17.06% |
| Asian | 5 | 1.18% |
| Native American | 6 | 1.42% |
| Hawaiian/Pac. Islander | 1 | 0.24% |
97136 Educational Attainment Levels
| Highest Education Level Attained | Total | Percentage |
|---|
| Less Than 1 Year of College | 138 | 10.87% |
| Bachelor Degree | 225 | 17.73% |
| High School Diploma | 418 | 32.94% |
| No High School Diploma | 14 | 1.1% |
| GED or Alternate | 38 | 2.99% |
| 1 or More Years of College | 274 | 21.59% |
| Associates Degree | 65 | 5.12% |
| Masters Degree | 85 | 6.7% |
| Professional Degree | 6 | 0.47% |
| Doctorate Degree | 6 | 0.47% |