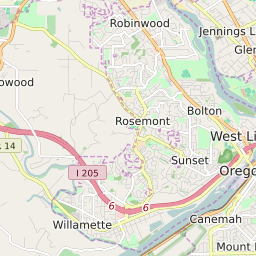
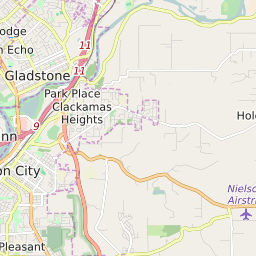
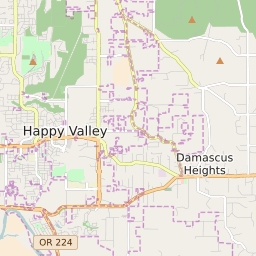
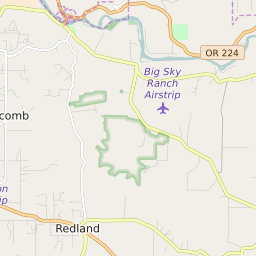
97267 can be classified socioeconomically as Lower Middle Class class compared to other ZIP Codes in Oregon based on Median Household Income and Average Adjusted Gross Income. The majority race/ethnicity residing in 97267 is White. The majority race/ethnicity attending public schools in 97267 is White. The current unemployment level in 97267 is 4.3%.
| Population | 31,130 |
| Population Growth Rate | -1.12% |
| Population Density | 4,220 People per Square Mile |
| Total Households | 12,635 |
| Percentage High Income Households | 2.8% |
| Median Household Income (2021) | $73,575 |
| Average Adjusted Gross Income (2021) | $386,450 |
| Current Unemployment Rate (February 2025) | 4.3% |
| Majority Race/Ethnicty | White - 85.55% |
| Public School Majority Race/Ethnicty | White - 60.48% |
97267 Race/Ethnicty Breakdown
| Race/Ethnicty | Total | Percentage |
|---|
| White | 27,061 | 85.55% |
| Black | 452 | 1.43% |
| Hispanic | 3,136 | 9.91% |
| Asian | 772 | 2.44% |
| Native American | 211 | 0.67% |
| Hawaiian/Pac. Islander | 0 | 0% |
97267 Public School Race/Ethnicty Breakdown
| Race/Ethnicty | Total | Percentage |
|---|
| White | 2,127 | 65.87% |
| Black | 54 | 1.67% |
| Hispanic | 943 | 29.2% |
| Asian | 79 | 2.45% |
| Native American | 16 | 0.5% |
| Hawaiian/Pac. Islander | 10 | 0.31% |
97267 Educational Attainment Levels
| Highest Education Level Attained | Total | Percentage |
|---|
| Less Than 1 Year of College | 2,357 | 11.18% |
| Bachelor Degree | 3,693 | 17.52% |
| High School Diploma | 4,860 | 23.05% |
| No High School Diploma | 356 | 1.69% |
| GED or Alternate | 1,013 | 4.8% |
| 1 or More Years of College | 5,244 | 24.87% |
| Associates Degree | 2,057 | 9.76% |
| Masters Degree | 1,123 | 5.33% |
| Professional Degree | 313 | 1.48% |
| Doctorate Degree | 67 | 0.32% |