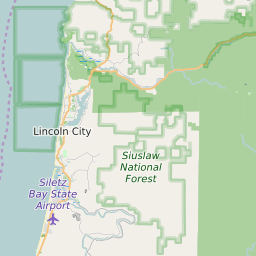
97367 can be classified socioeconomically as Lower Middle Class class compared to other ZIP Codes in Oregon based on Median Household Income and Average Adjusted Gross Income. The majority race/ethnicity residing in 97367 is White. The majority race/ethnicity attending public schools in 97367 is White. The current unemployment level in 97367 is 4.3%.
| Population | 11,230 |
| Population Growth Rate | 17.52% |
| Population Density | 83 People per Square Mile |
| Total Households | 4,614 |
| Percentage High Income Households | 0.6% |
| Median Household Income (2021) | $50,901 |
| Average Adjusted Gross Income (2021) | $475,070 |
| Current Unemployment Rate (February 2025) | 4.3% |
| Majority Race/Ethnicty | White - 85.69% |
| Public School Majority Race/Ethnicty | White - 60.66% |
97367 Race/Ethnicty Breakdown
| Race/Ethnicty | Total | Percentage |
|---|
| White | 9,350 | 85.69% |
| Black | 29 | 0.27% |
| Hispanic | 1,133 | 10.38% |
| Asian | 311 | 2.85% |
| Native American | 89 | 0.82% |
| Hawaiian/Pac. Islander | 0 | 0% |
97367 Public School Race/Ethnicty Breakdown
| Race/Ethnicty | Total | Percentage |
|---|
| White | 933 | 66.41% |
| Black | 9 | 0.64% |
| Hispanic | 399 | 28.4% |
| Asian | 20 | 1.42% |
| Native American | 40 | 2.85% |
| Hawaiian/Pac. Islander | 4 | 0.28% |
97367 Educational Attainment Levels
| Highest Education Level Attained | Total | Percentage |
|---|
| Less Than 1 Year of College | 744 | 11.89% |
| Bachelor Degree | 941 | 15.04% |
| High School Diploma | 1,618 | 25.85% |
| No High School Diploma | 199 | 3.18% |
| GED or Alternate | 486 | 7.77% |
| 1 or More Years of College | 1,411 | 22.55% |
| Associates Degree | 360 | 5.75% |
| Masters Degree | 348 | 5.56% |
| Professional Degree | 99 | 1.58% |
| Doctorate Degree | 52 | 0.83% |