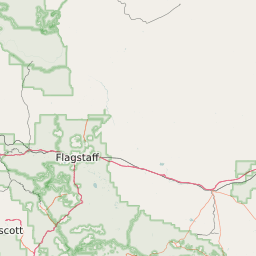
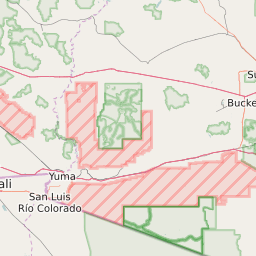
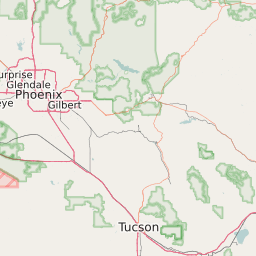
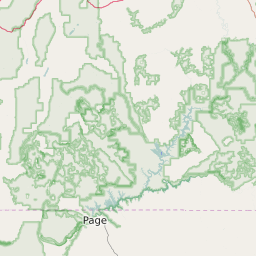
Map of Public School Majority Race and Ethnicity for Counties in Arizona
White | African American | Hispanic | Asian | Native American | Hawaiin/Pacific Islander |


List of Counties in Arizona With Public School Majority Race/Ethnicity | ||||
|---|---|---|---|---|
| Map Key | Name | Majority Race/Ethnicity | ||
| Apache County | Native American 77.6% | |||
| Cochise County | Hispanic 56.67% | |||
| Coconino County | Native American 41.5% | |||
| Gila County | White 42.09% | |||
| Graham County | White 42.61% | |||
| Greenlee County | Hispanic 54.66% | |||
| La Paz County | Hispanic 52.26% | |||
| Maricopa County | Hispanic 46.2% | |||
| Mohave County | White 62.5% | |||
| Navajo County | Native American 51.98% | |||
| Pima County | Hispanic 55.9% | |||
| Pinal County | Hispanic 47.19% | |||
| Santa Cruz County | Hispanic 96.76% | |||
| Yavapai County | White 61.12% | |||
| Yuma County | Hispanic 86.35% | |||