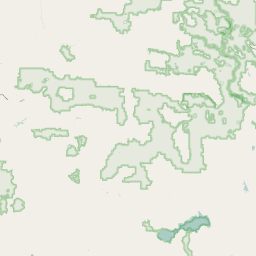
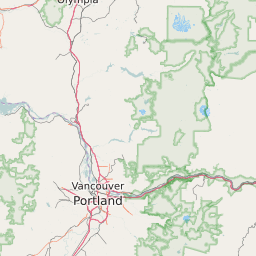
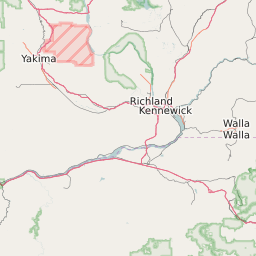
Map of Public School Majority Race and Ethnicity for Counties in Oregon
White | African American | Hispanic | Asian | Native American | Hawaiin/Pacific Islander |
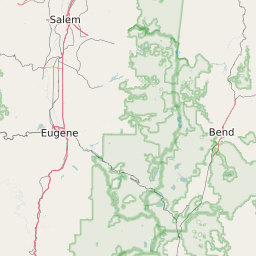


List of Counties in Oregon With Public School Majority Race/Ethnicity | ||||
|---|---|---|---|---|
| Map Key | Name | Majority Race/Ethnicity | ||
| Baker County | White 80.19% | |||
| Benton County | White 68.64% | |||
| Clackamas County | White 66.52% | |||
| Clatsop County | White 70.86% | |||
| Columbia County | White 79.02% | |||
| Coos County | White 73.03% | |||
| Crook County | White 73.52% | |||
| Curry County | White 69.15% | |||
| Deschutes County | White 78.35% | |||
| Douglas County | White 79.35% | |||
| Gilliam County | White 86.03% | |||
| Grant County | White 80.14% | |||
| Harney County | White 81.86% | |||
| Hood River County | White 49.96% | |||
| Jackson County | White 65.72% | |||
| Jefferson County | White 36.53% | |||
| Josephine County | White 75.44% | |||
| Klamath County | White 61.46% | |||
| Lake County | White 75% | |||
| Lane County | White 69.59% | |||
| Lincoln County | White 61.12% | |||
| Linn County | White 72.4% | |||
| Malheur County | Hispanic 51.29% | |||
| Marion County | Hispanic 46.97% | |||
| Morrow County | Hispanic 57.34% | |||
| Multnomah County | White 47.03% | |||
| Polk County | White 59.95% | |||
| Sherman County | White 84.27% | |||
| Tillamook County | White 67.49% | |||
| Umatilla County | White 46.35% | |||
| Union County | White 83.84% | |||
| Wallowa County | White 87.87% | |||
| Wasco County | White 53.29% | |||
| Washington County | White 45.96% | |||
| Wheeler County | White 88.92% | |||
| Yamhill County | White 64.06% | |||