SNAP/Food Stamp Participation in Illinois

of the 102 Counties in Illinois The County with the highest percentage of residents receiving SNAP/Food Stamps is Pulaski County with 59.4%. The County with the lowest percentage of residents receiving SNAP/Food Stamps is Alexander County with 0.0%. The data is provided by the US Department of Agriculture (July 2023).

Map List Related

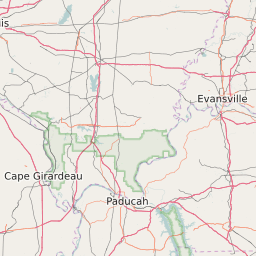
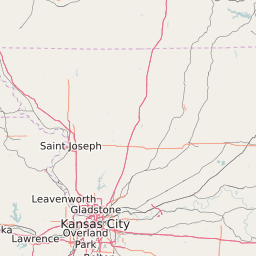
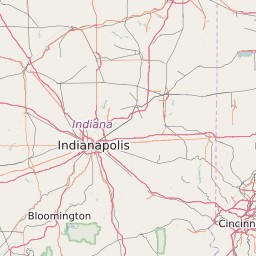
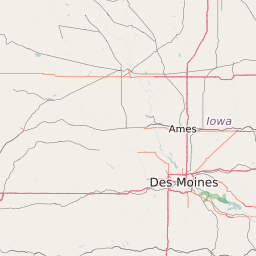
Map of Illinois SNAP/Food Stamp Participation Rate by County

0-5%
5% to 10%
10% to 15%
15% to 20%
20% to 25%
> 25%

List of Counties in Illinois with SNAP/Food Stamp Participation Rate (July 2023)

Map KeyNameTotal SNAP/Food Stamp RecipientsPercentage of Residents Receiving SNAP/Food Stamps
Adams County16,16324.1%
Alexander County00.0%
Bond County00.0%
Boone CountyN/AN/A
Brown CountyN/AN/A
Bureau County7,22920.8%
Calhoun CountyN/AN/A
Carroll County00.0%
Cass County3,32824.5%
Champaign County33,20216.5%
Christian County6,09317.5%
Clark CountyN/AN/A
Clay County00.0%
Clinton County00.0%
Coles County28,05252.2%
Cook County550.0%
Crawford County4,01620.3%
Cumberland CountyN/AN/A
De Witt CountyN/AN/A
DeKalb County14,10913.5%
Douglas County00.0%
DuPage County79,1018.6%
Edgar County00.0%
Edwards CountyN/AN/A
Effingham County00.0%
Fayette County00.0%
Ford CountyN/AN/A
Franklin County10,86527.5%
Fulton County5,60615.2%
Gallatin CountyN/AN/A
Greene County00.0%
Grundy CountyN/AN/A
Hamilton County00.0%
Hancock County00.0%
Hardin CountyN/AN/A
Henderson CountyN/AN/A
Henry County7,40614.7%
Iroquois County00.0%
Jackson County15,53425.9%
Jasper CountyN/AN/A
Jefferson County11,27029.0%
Jersey County5,47423.9%
Jo Daviess County00.0%
Johnson CountyN/AN/A
Kane County38,4097.5%
Kankakee County26,66423.6%
Kendall County00.0%
Knox County9,92518.8%
LaSalle County22,14619.5%
Lake County76,20810.9%
Lawrence County00.0%
Lee CountyN/AN/A
Livingston County00.0%
Logan County8,26827.3%
Macon County00.0%
Macoupin County6,92814.5%
Madison County00.0%
Marion County15,76640.1%
Marshall County00.0%
Mason County2,10714.4%
Massac County4,10526.7%
Mcdonough County4,65814.3%
Mchenry County20,3376.6%
Mclean County25,09614.8%
Menard CountyN/AN/A
Mercer CountyN/AN/A
Monroe CountyN/AN/A
Montgomery County5,53818.5%
Morgan County7,83922.1%
Moultrie County00.0%
Ogle County9,83818.4%
Peoria County41,99322.5%
Perry CountyN/AN/A
Piatt CountyN/AN/A
Pike County00.0%
Pope County00.0%
Pulaski County3,62759.4%
Putnam CountyN/AN/A
Randolph County5,82417.5%
Richland County8,13050.2%
Rock Island County27,90618.9%
Saint Clair County52,76519.6%
Saline County8,82035.3%
Sangamon County60.0%
Schuyler County00.0%
Scott CountyN/AN/A
Shelby County00.0%
Stark CountyN/AN/A
Stephenson County10,65822.4%
Tazewell County17,02212.6%
Union County00.0%
Vermilion County21,98427.0%
Wabash County5,29644.4%
Warren County5,37830.3%
Washington CountyN/AN/A
Wayne CountyN/AN/A
White County00.0%
Whiteside County11,39219.5%
Will County75,10811.1%
Williamson County13,84820.9%
Winnebago County00.0%
Woodford CountyN/AN/A

2024 zipdatamaps.com