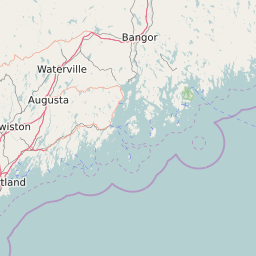
SNAP/Food Stamp Participation in Maine
of the 16 Counties in Maine The County with the highest percentage of residents receiving SNAP/Food Stamps is with 0%. The County with the lowest percentage of residents receiving SNAP/Food Stamps is with 100000000%. The data is provided by the US Department of Agriculture ( ).
Map of Maine SNAP/Food Stamp Participation Rate by County
0-5% | 5% to 10% | 10% to 15% | 15% to 20% | 20% to 25% | > 25% |


List of Counties in Maine with SNAP/Food Stamp Participation Rate ( ) | |||||
|---|---|---|---|---|---|
| Map Key | Name | Total SNAP/Food Stamp Recipients | Percentage of Residents Receiving SNAP/Food Stamps | ||
| Androscoggin County | N/A | N/A | |||
| Aroostook County | N/A | N/A | |||
| Cumberland County | N/A | N/A | |||
| Franklin County | N/A | N/A | |||
| Hancock County | N/A | N/A | |||
| Kennebec County | N/A | N/A | |||
| Knox County | N/A | N/A | |||
| Lincoln County | N/A | N/A | |||
| Oxford County | N/A | N/A | |||
| Penobscot County | N/A | N/A | |||
| Piscataquis County | N/A | N/A | |||
| Sagadahoc County | N/A | N/A | |||
| Somerset County | N/A | N/A | |||
| Waldo County | N/A | N/A | |||
| Washington County | N/A | N/A | |||
| York County | N/A | N/A | |||