SNAP/Food Stamp Participation in Massachusetts
of the 14 Counties in Massachusetts The County with the highest percentage of residents receiving SNAP/Food Stamps is with 0%. The County with the lowest percentage of residents receiving SNAP/Food Stamps is with 100000000%. The data is provided by the US Department of Agriculture ( ).
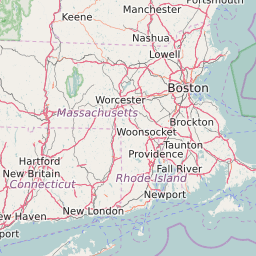
Map of Massachusetts SNAP/Food Stamp Participation Rate by County
0-5% | 5% to 10% | 10% to 15% | 15% to 20% | 20% to 25% | > 25% |


List of Counties in Massachusetts with SNAP/Food Stamp Participation Rate ( ) | |||||
|---|---|---|---|---|---|
| Map Key | Name | Total SNAP/Food Stamp Recipients | Percentage of Residents Receiving SNAP/Food Stamps | ||
| Barnstable County | N/A | N/A | |||
| Berkshire County | N/A | N/A | |||
| Bristol County | N/A | N/A | |||
| Dukes County | N/A | N/A | |||
| Essex County | N/A | N/A | |||
| Franklin County | N/A | N/A | |||
| Hampden County | N/A | N/A | |||
| Hampshire County | N/A | N/A | |||
| Middlesex County | N/A | N/A | |||
| Nantucket County | N/A | N/A | |||
| Norfolk County | N/A | N/A | |||
| Plymouth County | N/A | N/A | |||
| Suffolk County | N/A | N/A | |||
| Worcester County | N/A | N/A | |||