Title 1 Status for Public Schools in Illinois Counties

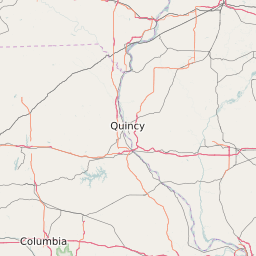
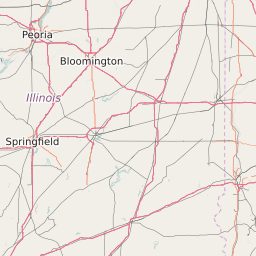
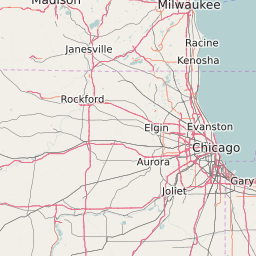
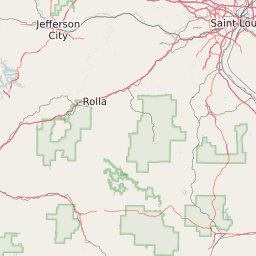
This map displays the percentage of public schools with title 1 status in each county in Illinois. Title 1 is the largest federally funded educational program. The program provides supplemental funds to school districts to assist schools with the highest student concentrations of poverty to meet school educational goals. A title 1 school is a school receiving federal funds for Title 1 students. Not all schools that are eligible for Title 1 funds participate in the program. Title 1 data is from the NCES 2018 Public Elementary/Secondary School Universe Survey Data.

Map List Related

Map of Illinois Counties with Percentage of Title 1 Schools

0-20%
20% to 40%
40% to 60%
60% to 80%
80% to 100%

List of Counties in Illinois With Public School Title 1 Status

Map KeyNameTotal Title 1 SchoolsPercentage of All Schools with Title 1 Status
Adams County2191.3%
Alexander County571.4%
Bond County787.5%
Boone County17100.0%
Brown County3100.0%
Bureau County2195.5%
Calhoun County4100.0%
Carroll County7100.0%
Cass County8100.0%
Champaign County5485.7%
Christian County1894.7%
Clark County888.9%
Clay County8100.0%
Clinton County16100.0%
Coles County1773.9%
Cook County116282.8%
Crawford County10100.0%
Cumberland County571.4%
De Witt County9100.0%
DeKalb County3992.9%
Douglas County9100.0%
DuPage County18769.0%
Edgar County1688.9%
Edwards County5100.0%
Effingham County1593.8%
Fayette County1794.4%
Ford County888.9%
Franklin County2187.5%
Fulton County2696.3%
Gallatin County3100.0%
Greene County6100.0%
Grundy County1575.0%
Hamilton County4100.0%
Hancock County1493.3%
Hardin County3100.0%
Henderson County4100.0%
Henry County2592.6%
Iroquois County2191.3%
Jackson County2480.0%
Jasper County685.7%
Jefferson County2492.3%
Jersey County770.0%
Jo Daviess County1995.0%
Johnson County8100.0%
Kane County10570.0%
Kankakee County4093.0%
Kendall County3678.3%
Knox County1982.6%
Lake County13862.7%
LaSalle County4483.0%
Lawrence County6100.0%
Lee County1372.2%
Livingston County2195.5%
Logan County1493.3%
Macon County3687.8%
Macoupin County2583.3%
Madison County7792.8%
Marion County2890.3%
Marshall County981.8%
Mason County685.7%
Massac County9100.0%
Mcdonough County1266.7%
Mchenry County8491.3%
Mclean County5185.0%
Menard County7100.0%
Mercer County11100.0%
Monroe County1794.4%
Montgomery County1688.9%
Morgan County2485.7%
Moultrie County8100.0%
Ogle County2180.8%
Peoria County6787.0%
Perry County1285.7%
Piatt County1090.9%
Pike County12100.0%
Pope County2100.0%
Pulaski County480.0%
Putnam County4100.0%
Randolph County888.9%
Richland County3100.0%
Rock Island County5090.9%
Saint Clair County8693.5%
Saline County1493.3%
Sangamon County6787.0%
Schuyler County480.0%
Scott County5100.0%
Shelby County13100.0%
Stark County5100.0%
Stephenson County2295.7%
Tazewell County5694.9%
Union County1482.3%
Vermilion County3587.5%
Wabash County5100.0%
Warren County10100.0%
Washington County7100.0%
Wayne County12100.0%
White County1292.3%
Whiteside County2857.1%
Will County18484.8%
Williamson County2488.9%
Winnebago County8593.4%
Woodford County2071.4%

2025 zipdatamaps.com