Partisan Voting Index for Counties in New Jersey
This Map Displays the Partisan Voting Index Value for each county in New Jersey. The Partisan Voting Index (PVI) is a measurement of how strongly a county leans toward the Democratic or Republican Party. The PVI is calculated by taking the average percentage for the winning party in a county for the last two elections and subtracting that value from the national average for that party in the same two elections. The data is based on results from the 2024 and 2020 presidential election. Of the 21 Counties in New Jersey The County with the highest Republican PVI is Ocean County at +17. The County with the highest Democrat PVI is Essex County at +25.
Map of Partisan Voting Index (PVI) for Counties in New Jersey
Rep +20 | Rep. 15-19 | Rep. 10-14 | Rep. 5-9 | Rep. 1-4 | Even | Dem 1-4 | Dem 5-9 | Dem 10-14 | Dem 15-19 | Dem +20 |
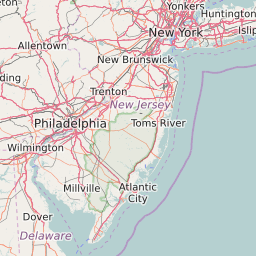


List of All Counties in New Jersey With Partisan Voting Index (2024 Presidential Election Results) | ||||
|---|---|---|---|---|
| Map Key | Name | Partisan Voting Index (2024) | ||
| Atlantic County | Even +0 | |||
| Bergen County | Democrat +4 | |||
| Burlington County | Democrat +9 | |||
| Camden County | Democrat +15 | |||
| Cape May County | Republican +10 | |||
| Cumberland County | Republican +1 | |||
| Essex County | Democrat +25 | |||
| Gloucester County | Republican +1 | |||
| Hudson County | Democrat +18 | |||
| Hunterdon County | Republican +4 | |||
| Mercer County | Democrat +18 | |||
| Middlesex County | Democrat +7 | |||
| Monmouth County | Republican +4 | |||
| Morris County | Even +0 | |||
| Ocean County | Republican +17 | |||
| Passaic County | Republican +3 | |||
| Salem County | Republican +9 | |||
| Somerset County | Democrat +8 | |||
| Sussex County | Republican +12 | |||
| Union County | Democrat +14 | |||
| Warren County | Republican +10 | |||