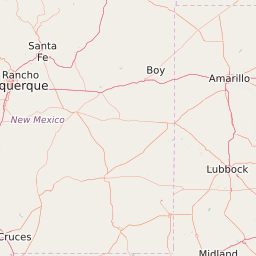
Partisan Voting Index for Counties in New Mexico
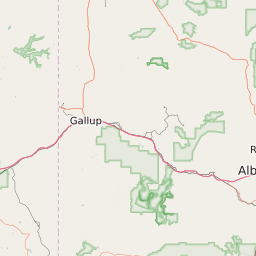
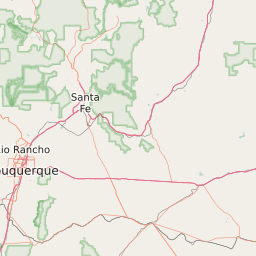
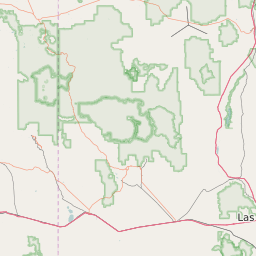
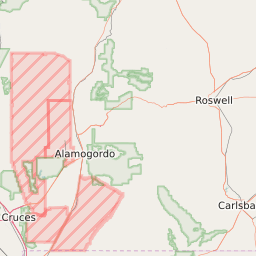
This Map Displays the Partisan Voting Index Value for each county in New Mexico. The Partisan Voting Index (PVI) is a measurement of how strongly a county leans toward the Democratic or Republican Party. The PVI is calculated by taking the average percentage for the winning party in a county for the last two elections and subtracting that value from the national average for that party in the same two elections. The data is based on results from the 2024 and 2020 presidential election. Of the 33 Counties in New Mexico The County with the highest Republican PVI is Lea County at +31. The County with the highest Democrat PVI is Santa Fe County at +25.
Map of Partisan Voting Index (PVI) for Counties in New Mexico
Rep +20 | Rep. 15-19 | Rep. 10-14 | Rep. 5-9 | Rep. 1-4 | Even | Dem 1-4 | Dem 5-9 | Dem 10-14 | Dem 15-19 | Dem +20 |


List of All Counties in New Mexico With Partisan Voting Index (2024 Presidential Election Results) | ||||
|---|---|---|---|---|
| Map Key | Name | Partisan Voting Index (2024) | ||
| Bernalillo County | Democrat +10 | |||
| Catron County | Republican +25 | |||
| Chaves County | Republican +22 | |||
| Cibola County | Democrat +2 | |||
| Colfax County | Republican +7 | |||
| Curry County | Republican +21 | |||
| De Baca County | Republican +25 | |||
| Dona Ana County | Democrat +6 | |||
| Eddy County | Republican +28 | |||
| Grant County | Democrat +2 | |||
| Guadalupe County | Democrat +3 | |||
| Harding County | Republican +18 | |||
| Hidalgo County | Republican +11 | |||
| Lea County | Republican +31 | |||
| Lincoln County | Republican +20 | |||
| Los Alamos County | Democrat +13 | |||
| Luna County | Republican +8 | |||
| Mckinley County | Democrat +15 | |||
| Mora County | Democrat +12 | |||
| Otero County | Republican +14 | |||
| Quay County | Republican +20 | |||
| Rio Arriba County | Democrat +13 | |||
| Roosevelt County | Republican +22 | |||
| San Juan County | Republican +16 | |||
| San Miguel County | Democrat +16 | |||
| Sandoval County | Democrat +3 | |||
| Santa Fe County | Democrat +25 | |||
| Sierra County | Republican +11 | |||
| Socorro County | Even +0 | |||
| Taos County | Democrat +25 | |||
| Torrance County | Republican +18 | |||
| Union County | Republican +28 | |||
| Valencia County | Republican +7 | |||