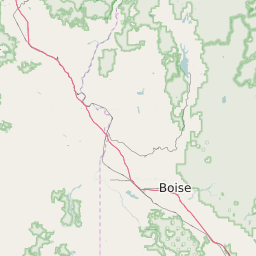
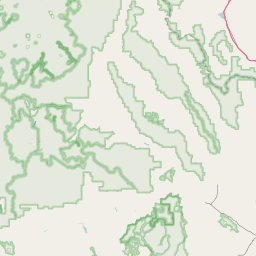
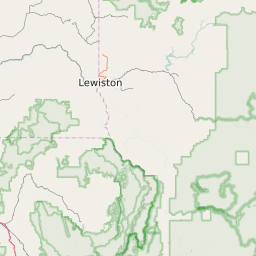
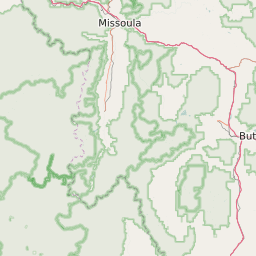
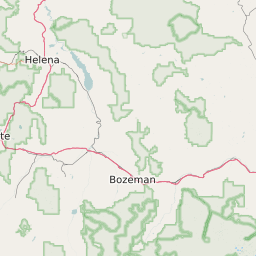
Population Change for Counties in Idaho - 2010 to 2022
of the 44 Counties in Idaho the fastest growing County is Madison County with 40.97% growth. The County lowest growth is Clark County with -19.55% growth.
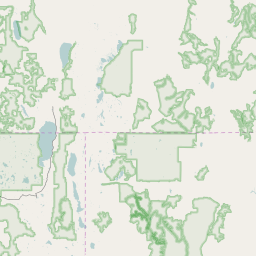
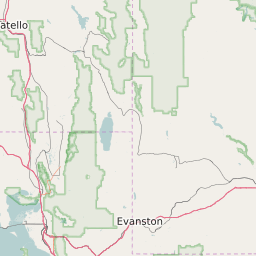
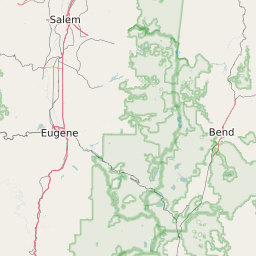
Idaho Population Change Map
< -15% | -15% to -5% | -5% to 0% | 0% to 5% | 5% to 15% | > 15% |

List of Counties in Idaho With Population Percentage Change | |||||
|---|---|---|---|---|---|
| Map Key | Name | Population Change | Population | ||
| Ada County | 26.15% | 394,961 | |||
| Adams County | 10.14% | 3,976 | |||
| Bannock County | 5.04% | 82,584 | |||
| Bear Lake County | 6.45% | 5,977 | |||
| Benewah County | 2.64% | 9,247 | |||
| Bingham County | 5.23% | 45,312 | |||
| Blaine County | 13.55% | 21,323 | |||
| Boise County | 8.28% | 7,014 | |||
| Bonner County | 15.25% | 40,806 | |||
| Bonneville County | 18.93% | 104,177 | |||
| Boundary County | 9.88% | 10,857 | |||
| Butte County | -10.97% | 2,828 | |||
| Camas County | -3.58% | 1,276 | |||
| Canyon County | 22.33% | 189,396 | |||
| Caribou County | 0.92% | 6,872 | |||
| Cassia County | 7.42% | 22,813 | |||
| Clark County | -19.55% | 780 | |||
| Clearwater County | -0.31% | 8,679 | |||
| Custer County | -2.13% | 4,338 | |||
| Elmore County | 6.02% | 26,655 | |||
| Franklin County | 11.01% | 12,739 | |||
| Fremont County | 1.1% | 13,123 | |||
| Gem County | 14.38% | 16,768 | |||
| Gooding County | 0.87% | 15,327 | |||
| Idaho County | 1.68% | 16,215 | |||
| Jefferson County | 18.18% | 25,940 | |||
| Jerome County | 8.33% | 22,140 | |||
| Kootenai County | 23.73% | 139,083 | |||
| Latah County | 6.1% | 37,365 | |||
| Lemhi County | 0.48% | 7,892 | |||
| Lewis County | -7.54% | 3,818 | |||
| Lincoln County | -1.56% | 5,167 | |||
| Madison County | 40.97% | 37,311 | |||
| Minidoka County | 7.69% | 19,909 | |||
| Nez Perce County | 7.19% | 39,226 | |||
| Oneida County | 6.49% | 4,236 | |||
| Owyhee County | 3.36% | 11,479 | |||
| Payette County | 12.21% | 22,614 | |||
| Power County | 0.78% | 7,717 | |||
| Shoshone County | 3.16% | 12,797 | |||
| Teton County | 14.36% | 10,007 | |||
| Twin Falls County | 16.59% | 77,122 | |||
| Valley County | 19.1% | 9,793 | |||
| Washington County | 2.96% | 10,144 | |||