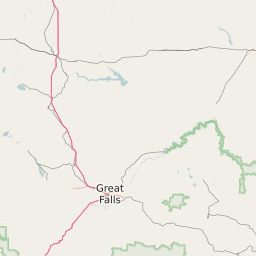
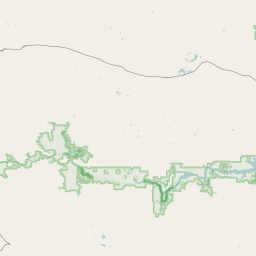
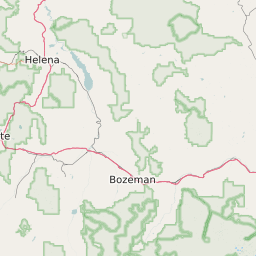
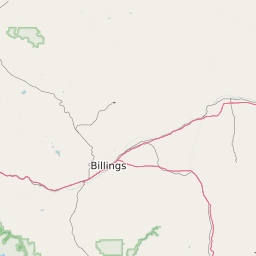
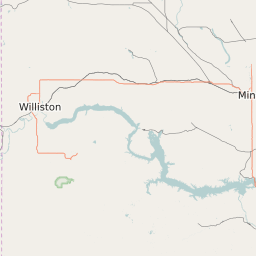
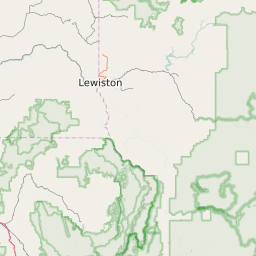
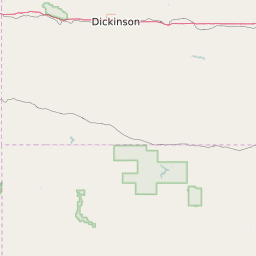
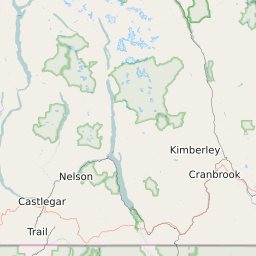
Population Change for Counties in Montana - 2010 to 2022

of the 56 Counties in Montana the fastest growing County is Gallatin County with 32.9% growth. The County lowest growth is Liberty County with -16.25% growth.

Map List Related

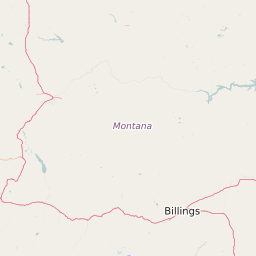
Montana Population Change Map

< -15%
-15% to -5%
-5% to 0%
0% to 5%
5% to 15%
> 15%

List of Counties in Montana With Population Percentage Change

Map KeyNamePopulation ChangePopulation
Beaverhead County1.35%9,228
Big Horn County2.01%12,872
Blaine County8.52%6,514
Broadwater County20.71%5,575
Carbon County3.92%10,057
Carter County21.98%1,276
Cascade County3.8%81,248
Chouteau County1.41%5,811
Custer County1.44%11,706
Daniels County-5.14%1,734
Dawson County-0.29%9,022
Deer Lodge County1.32%9,277
Fallon County5.5%3,051
Fergus County-1.21%11,507
Flathead County14.77%90,967
Gallatin County32.9%90,339
Garfield County-2.74%1,100
Glacier County2.83%13,422
Golden Valley County-6.9%769
Granite County7.47%3,083
Hill County1.32%16,157
Jefferson County5.95%11,360
Judith Basin County-2.36%2,052
Lake County8.31%28,794
Lewis and Clark County11.95%63,432
Liberty County-16.25%2,326
Lincoln County-0.05%19,594
Madison County12.12%7,688
Mccone County-0.29%1,808
Meagher County1.9%1,900
Mineral County7.39%4,203
Missoula County7.89%109,402
Musselshell County4.23%4,597
Park County9.94%15,655
Petroleum County0.4%566
Phillips County-0.85%4,203
Pondera County-4.14%6,147
Powder River County-2.81%1,639
Powell County-1.15%7,067
Prairie County-7.72%1,193
Ravalli County9.85%40,311
Richland County17.9%9,961
Roosevelt County3.54%10,477
Rosebud County-9.79%9,261
Sanders County8.65%11,421
Sheridan County4.58%3,447
Silver Bow County2.73%34,164
Stillwater County-1.69%9,096
Sweet Grass County0.74%3,661
Teton County2.52%6,082
Toole County-6.63%5,210
Treasure County6.13%698
Valley County2.84%7,423
Wheatland County-4.57%2,142
Wibaux County-7.87%899
Yellowstone County11.33%148,191

2025 zipdatamaps.com