Population Change for Counties in Oklahoma - 2010 to 2022
of the 77 Counties in Oklahoma the fastest growing County is Canadian County with 33.64% growth. The County lowest growth is Blaine County with -26.86% growth.
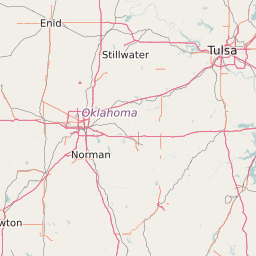
Oklahoma Population Change Map
< -15% | -15% to -5% | -5% to 0% | 0% to 5% | 5% to 15% | > 15% |

List of Counties in Oklahoma With Population Percentage Change | |||||
|---|---|---|---|---|---|
| Map Key | Name | Population Change | Population | ||
| Adair County | -14.05% | 22,470 | |||
| Alfalfa County | 1.01% | 5,631 | |||
| Atoka County | -0.27% | 14,133 | |||
| Beaver County | -10.42% | 5,587 | |||
| Beckham County | 1.32% | 22,519 | |||
| Blaine County | -26.86% | 10,651 | |||
| Bryan County | 8.61% | 42,494 | |||
| Caddo County | -8.97% | 29,403 | |||
| Canadian County | 33.64% | 116,299 | |||
| Carter County | 0.94% | 47,603 | |||
| Cherokee County | 0.19% | 47,165 | |||
| Choctaw County | -6.58% | 15,172 | |||
| Cimarron County | -7.23% | 2,451 | |||
| Cleveland County | 15.55% | 256,550 | |||
| Coal County | -11.12% | 5,906 | |||
| Comanche County | -2.4% | 123,101 | |||
| Cotton County | -10.75% | 6,171 | |||
| Craig County | -6.13% | 14,922 | |||
| Creek County | 2.55% | 69,934 | |||
| Custer County | 3.8% | 27,583 | |||
| Delaware County | -2.63% | 41,332 | |||
| Dewey County | -6.78% | 4,775 | |||
| Ellis County | -9.68% | 4,095 | |||
| Garfield County | 3.74% | 60,272 | |||
| Garvin County | -6.96% | 27,471 | |||
| Grady County | 4.51% | 52,451 | |||
| Grant County | -7.91% | 4,536 | |||
| Greer County | -11.99% | 6,185 | |||
| Harmon County | -14.85% | 2,888 | |||
| Harper County | -11.21% | 3,672 | |||
| Haskell County | -9.46% | 12,761 | |||
| Hughes County | -4.54% | 13,762 | |||
| Jackson County | -6.28% | 26,275 | |||
| Jefferson County | -17.54% | 6,445 | |||
| Johnston County | -6.25% | 10,938 | |||
| Kay County | -6.15% | 46,288 | |||
| Kingfisher County | 1% | 14,965 | |||
| Kiowa County | -9.92% | 9,421 | |||
| Latimer County | -15.33% | 11,099 | |||
| Le Flore County | -4.48% | 50,056 | |||
| Lincoln County | -2.38% | 34,106 | |||
| Logan County | 18.42% | 41,982 | |||
| Love County | 7.67% | 9,404 | |||
| Major County | 3.39% | 7,563 | |||
| Marshall County | -3.33% | 15,774 | |||
| Mayes County | -5.36% | 41,162 | |||
| Mcclain County | 20.74% | 34,471 | |||
| Mccurtain County | -7.05% | 33,144 | |||
| Mcintosh County | -6.47% | 20,266 | |||
| Murray County | 3.08% | 13,460 | |||
| Muskogee County | -6.55% | 70,635 | |||
| Noble County | -5.51% | 11,540 | |||
| Nowata County | -11.54% | 10,627 | |||
| Okfuskee County | -7.23% | 12,203 | |||
| Oklahoma County | 10.81% | 721,088 | |||
| Okmulgee County | -8.39% | 39,770 | |||
| Osage County | -3.48% | 47,650 | |||
| Ottawa County | -4.91% | 31,940 | |||
| Pawnee County | -6.18% | 16,573 | |||
| Payne County | 5.55% | 77,125 | |||
| Pittsburg County | -4.5% | 45,570 | |||
| Pontotoc County | 1.53% | 37,438 | |||
| Pottawatomie County | 4.34% | 69,676 | |||
| Pushmataha County | -6.57% | 11,449 | |||
| Roger Mills County | -5.62% | 3,678 | |||
| Rogers County | 9.59% | 87,031 | |||
| Seminole County | -7.56% | 25,394 | |||
| Sequoyah County | -7.34% | 41,945 | |||
| Stephens County | -4.88% | 44,848 | |||
| Texas County | 3.6% | 20,620 | |||
| Tillman County | -12.81% | 7,981 | |||
| Tulsa County | 10.92% | 602,692 | |||
| Wagoner County | 10.8% | 73,067 | |||
| Washington County | 2.9% | 51,112 | |||
| Washita County | -6.06% | 11,616 | |||
| Woods County | -2.86% | 8,741 | |||
| Woodward County | 1.94% | 20,232 | |||