Map of Poorest ZIP Codes in Bowling Green Area Based on Average Adjusted Gross Income
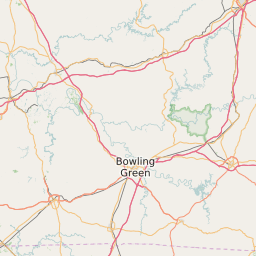
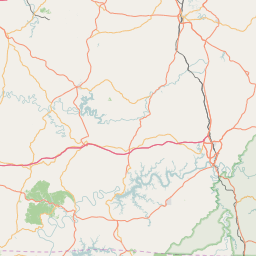
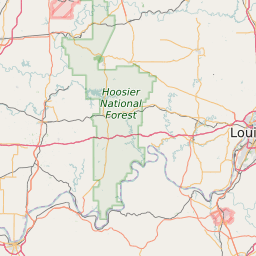
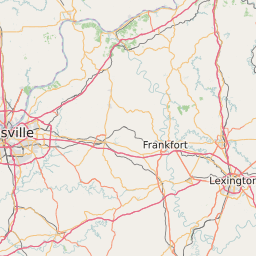
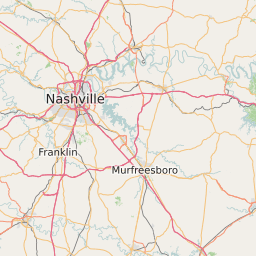
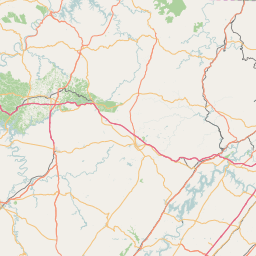
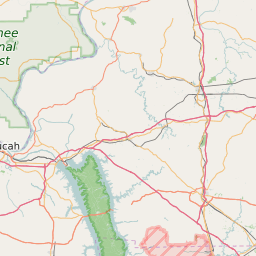
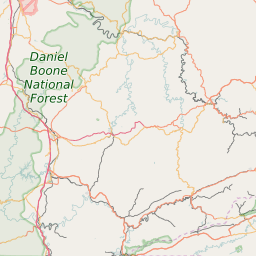


Source: US Internal Revenue Service - 2021
View Map of Wealthiest ZIP Codes in Bowling Green Area
List of Poorest ZIP Codes in Bowling Green Area | |||||||||
|---|---|---|---|---|---|---|---|---|---|
| Rank | Map Key | Zipcode | Zip Name | County | Adjusted Gross Income | Median Household Income | |||
| 1 | 42157 | Mount Hermon | Monroe | $88670 | $41932 | ||||
| 2 | 42285 | Sweeden | Edmonson | $89680 | $49271 | ||||
| 3 | 42154 | Knob Lick | Metcalfe | $111350 | $42917 | ||||
| 4 | 42713 | Bonnieville | Hart | $123560 | $30707 | ||||
| 5 | 42123 | Austin | Barren | $124980 | $44500 | ||||
| 6 | 42746 | Hardyville | Hart | $125820 | $37750 | ||||
| 7 | 42214 | Center | Metcalfe | $126570 | $25630 | ||||
| 8 | 42160 | Park City | Barren | $136830 | $45333 | ||||
| 9 | 42275 | Roundhill | Butler | $137270 | $40750 | ||||
| 10 | 42120 | Adolphus | Allen | $139690 | $37194 | ||||
| 11 | 42784 | Upton | Hart | $141350 | $35652 | ||||
| 12 | 42207 | Bee Spring | Edmonson | $143600 | $35968 | ||||
| 13 | 42722 | Canmer | Hart | $151950 | $32917 | ||||
| 14 | 42757 | Magnolia | Hart | $152710 | $47426 | ||||
| 15 | 42166 | Summer Shade | Metcalfe | $152880 | $37889 | ||||
| 16 | 42259 | Mammoth Cave | Edmonson | $157540 | $48398 | ||||