
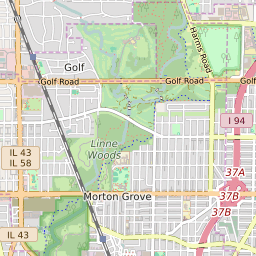


Morton Grove Illinois Profile
| Place Name | Morton Grove |
| Place Type | Village |
| ZIP Code(s) | 60053 |
| County | Cook County |
| Area Code(s) | 224,847 |
| Timezone | Central Daylight Time (CDT) |
| Population (2022) | 23,194 |
| Population Growth Rate (2010-19) | 8.71% |
| Majority Ethnicity | White 58.6% |
| Metro/Micro Stats Area | Chicago-Naperville-Elgin, IL-IN-WI |
| US Congressional District(s) | Illinois 9th Illinois 10th |
| State House Districts | 15,16 |
| State Senate Districts | 8 |
Morton Grove Race/Ethnicity Data
| Race/Ethnicy | Percentage of Population (2021) |
|---|---|
| White | 58.6% |
| African American | 0.91% |
| Hispanic | 0.65% |
| Asian | 33.63% |
| Native American | 0% |
| Hawaiin/Pacific Islander | 6.2% |