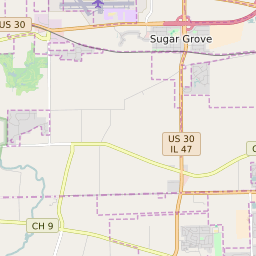
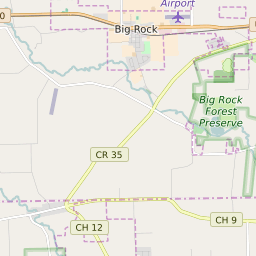
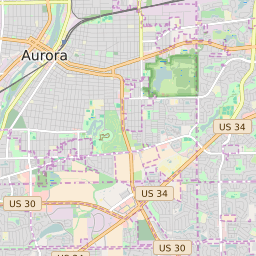
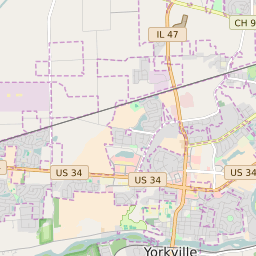
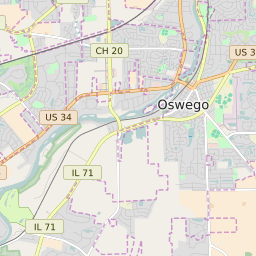


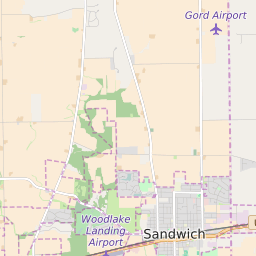
Sugar Grove Illinois Profile
| Place Name | Sugar Grove |
| Place Type | Village |
| ZIP Code(s) | 60554 |
| County | Kane County |
| Area Code(s) | 331,630 |
| Timezone | Central Standard Time (CST) |
| Population (2022) | 8,831 |
| Population Growth Rate (2010-19) | 3.12% |
| Majority Ethnicity | White 75.35% |
| Metro/Micro Stats Area | Chicago-Naperville-Elgin, IL-IN-WI |
| US Congressional District(s) | Illinois 14th |
| State House Districts | 50,70 |
| State Senate Districts | 25,35 |
Sugar Grove Race/Ethnicity Data
| Race/Ethnicy | Percentage of Population (2021) |
|---|---|
| White | 75.35% |
| African American | 7.35% |
| Hispanic | 0.12% |
| Asian | 5.73% |
| Native American | 0% |
| Hawaiin/Pacific Islander | 11.44% |