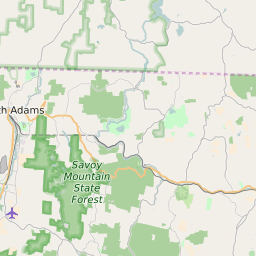
01330 can be classified socioeconomically as Lower Middle Class class compared to other ZIP Codes in Massachusetts based on Median Household Income and Average Adjusted Gross Income. The majority race/ethnicity residing in 01330 is White. The majority race/ethnicity attending public schools in 01330 is White. The current unemployment level in 01330 is 4.2%.
| Population | 1,607 |
| Population Growth Rate | 5.04% |
| Population Density | 45 People per Square Mile |
| Total Households | 640 |
| Percentage High Income Households | 5.6% |
| Median Household Income (2021) | $74,355 |
| Average Adjusted Gross Income (2021) | $489,080 |
| Current Unemployment Rate (February 2025) | 4.2% |
| Majority Race/Ethnicty | White - 92.34% |
| Public School Majority Race/Ethnicty | White - 95.38% |
01330 Race/Ethnicty Breakdown
| Race/Ethnicty | Total | Percentage |
|---|
| White | 1,374 | 92.34% |
| Black | 0 | 0% |
| Hispanic | 99 | 6.65% |
| Asian | 15 | 1.01% |
| Native American | 0 | 0% |
| Hawaiian/Pac. Islander | 0 | 0% |
01330 Public School Race/Ethnicty Breakdown
| Race/Ethnicty | Total | Percentage |
|---|
| White | 124 | 96.88% |
| Black | 0 | 0% |
| Hispanic | 4 | 3.13% |
| Asian | 0 | 0% |
| Native American | 0 | 0% |
| Hawaiian/Pac. Islander | 0 | 0% |
01330 Educational Attainment Levels
| Highest Education Level Attained | Total | Percentage |
|---|
| Less Than 1 Year of College | 23 | 2.15% |
| Bachelor Degree | 268 | 25.07% |
| High School Diploma | 221 | 20.67% |
| No High School Diploma | 4 | 0.37% |
| GED or Alternate | 17 | 1.59% |
| 1 or More Years of College | 186 | 17.4% |
| Associates Degree | 124 | 11.6% |
| Masters Degree | 175 | 16.37% |
| Professional Degree | 33 | 3.09% |
| Doctorate Degree | 18 | 1.68% |