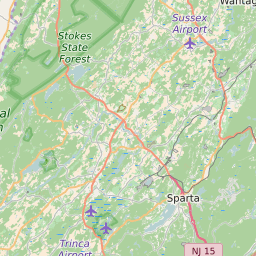
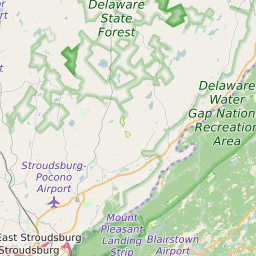
07438 can be classified socioeconomically as Middle Class class compared to other ZIP Codes in New Jersey based on Median Household Income and Average Adjusted Gross Income. The majority race/ethnicity residing in 07438 is White. The majority race/ethnicity attending public schools in 07438 is White. The current unemployment level in 07438 is 4.2%.
| Population | 11,209 |
| Population Growth Rate | -2.76% |
| Population Density | 468 People per Square Mile |
| Total Households | 4,134 |
| Percentage High Income Households | 6.3% |
| Median Household Income (2021) | $112,570 |
| Average Adjusted Gross Income (2021) | $333,050 |
| Current Unemployment Rate (January 2025) | 4.2% |
| Majority Race/Ethnicty | White - 91.65% |
| Public School Majority Race/Ethnicty | White - 81.32% |
07438 Race/Ethnicty Breakdown
| Race/Ethnicty | Total | Percentage |
|---|
| White | 10,242 | 91.65% |
| Black | 21 | 0.19% |
| Hispanic | 638 | 5.71% |
| Asian | 243 | 2.17% |
| Native American | 31 | 0.28% |
| Hawaiian/Pac. Islander | 0 | 0% |
07438 Public School Race/Ethnicty Breakdown
| Race/Ethnicty | Total | Percentage |
|---|
| White | 1,898 | 83.17% |
| Black | 32 | 1.4% |
| Hispanic | 258 | 11.31% |
| Asian | 86 | 3.77% |
| Native American | 6 | 0.26% |
| Hawaiian/Pac. Islander | 2 | 0.09% |
07438 Educational Attainment Levels
| Highest Education Level Attained | Total | Percentage |
|---|
| Less Than 1 Year of College | 372 | 4.96% |
| Bachelor Degree | 1,987 | 26.47% |
| High School Diploma | 2,266 | 30.19% |
| No High School Diploma | 206 | 2.74% |
| GED or Alternate | 133 | 1.77% |
| 1 or More Years of College | 1,276 | 17% |
| Associates Degree | 527 | 7.02% |
| Masters Degree | 616 | 8.21% |
| Professional Degree | 76 | 1.01% |
| Doctorate Degree | 48 | 0.64% |