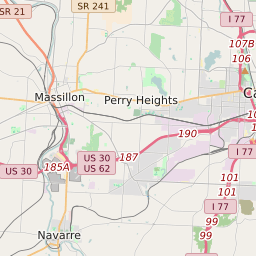
44720 can be classified socioeconomically as Lower Middle Class class compared to other ZIP Codes in Ohio based on Median Household Income and Average Adjusted Gross Income. The majority race/ethnicity residing in 44720 is White. The majority race/ethnicity attending public schools in 44720 is White. The current unemployment level in 44720 is 3.9%.
| Population | 39,942 |
| Population Growth Rate | 3.88% |
| Population Density | 1,210 People per Square Mile |
| Total Households | 16,148 |
| Percentage High Income Households | 3.4% |
| Median Household Income (2021) | $71,905 |
| Average Adjusted Gross Income (2021) | $476,040 |
| Current Unemployment Rate (January 2025) | 3.9% |
| Majority Race/Ethnicty | White - 94.62% |
| Public School Majority Race/Ethnicty | White - 88.41% |
44720 Race/Ethnicty Breakdown
| Race/Ethnicty | Total | Percentage |
|---|
| White | 37,373 | 94.62% |
| Black | 604 | 1.53% |
| Hispanic | 702 | 1.78% |
| Asian | 781 | 1.98% |
| Native American | 36 | 0.09% |
| Hawaiian/Pac. Islander | 0 | 0% |
44720 Public School Race/Ethnicty Breakdown
| Race/Ethnicty | Total | Percentage |
|---|
| White | 3,767 | 93.08% |
| Black | 118 | 2.92% |
| Hispanic | 85 | 2.1% |
| Asian | 75 | 1.85% |
| Native American | 2 | 0.05% |
| Hawaiian/Pac. Islander | 0 | 0% |
44720 Educational Attainment Levels
| Highest Education Level Attained | Total | Percentage |
|---|
| Less Than 1 Year of College | 2,114 | 7.96% |
| Bachelor Degree | 6,726 | 25.34% |
| High School Diploma | 7,504 | 28.27% |
| No High School Diploma | 243 | 0.92% |
| GED or Alternate | 395 | 1.49% |
| 1 or More Years of College | 4,100 | 15.45% |
| Associates Degree | 2,212 | 8.33% |
| Masters Degree | 2,542 | 9.58% |
| Professional Degree | 510 | 1.92% |
| Doctorate Degree | 197 | 0.74% |