60022 can be classified socioeconomically as Upper Middle Class class compared to other ZIP Codes in Illinois based on Median Household Income and Average Adjusted Gross Income. The majority race/ethnicity residing in 60022 is White. The majority race/ethnicity attending public schools in 60022 is White. The current unemployment level in 60022 is 4.3%.
| Population | 8,529 |
| Population Growth Rate | 0.00% |
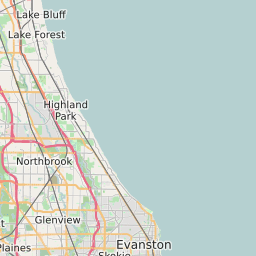
| Population Density | 2,047 People per Square Mile |
| Total Households | 2,809 |
| Percentage High Income Households | 47.1% |
| Median Household Income (2021) | $210,000 |
| Average Adjusted Gross Income (2021) | $1,573,660 |
| Current Unemployment Rate (February 2025) | 4.3% |
| Majority Race/Ethnicty | White - 95.26% |
| Public School Majority Race/Ethnicty | White - 84.00% |
60022 Race/Ethnicty Breakdown
| Race/Ethnicty | Total | Percentage |
|---|
| White | 8,083 | 95.26% |
| Black | 128 | 1.51% |
| Hispanic | 74 | 0.87% |
| Asian | 200 | 2.36% |
| Native American | 0 | 0% |
| Hawaiian/Pac. Islander | 0 | 0% |
60022 Public School Race/Ethnicty Breakdown
| Race/Ethnicty | Total | Percentage |
|---|
| White | 1,013 | 87.55% |
| Black | 3 | 0.26% |
| Hispanic | 75 | 6.48% |
| Asian | 63 | 5.45% |
| Native American | 3 | 0.26% |
| Hawaiian/Pac. Islander | 0 | 0% |
60022 Educational Attainment Levels
| Highest Education Level Attained | Total | Percentage |
|---|
| Less Than 1 Year of College | 35 | 0.68% |
| Bachelor Degree | 1,790 | 34.6% |
| High School Diploma | 175 | 3.38% |
| No High School Diploma | 1 | 0.02% |
| GED or Alternate | 0 | 0% |
| 1 or More Years of College | 393 | 7.6% |
| Associates Degree | 105 | 2.03% |
| Masters Degree | 1,265 | 24.45% |
| Professional Degree | 1,184 | 22.88% |
| Doctorate Degree | 226 | 4.37% |