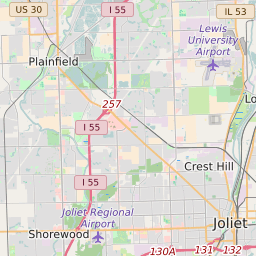
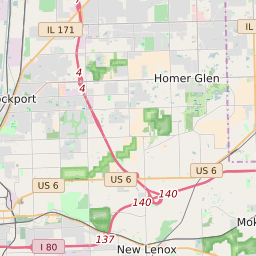
60404 can be classified socioeconomically as Middle Class class compared to other ZIP Codes in Illinois based on Median Household Income and Average Adjusted Gross Income. The majority race/ethnicity residing in 60404 is White. The majority race/ethnicity attending public schools in 60404 is White. The current unemployment level in 60404 is 4.3%.
| Population | 19,668 |
| Population Growth Rate | 0.00% |
| Population Density | 1,308 People per Square Mile |
| Total Households | 5,972 |
| Percentage High Income Households | 5.9% |
| Median Household Income (2021) | $110,349 |
| Average Adjusted Gross Income (2021) | $346,040 |
| Current Unemployment Rate (February 2025) | 4.3% |
| Majority Race/Ethnicty | White - 80.74% |
| Public School Majority Race/Ethnicty | White - 54.21% |
60404 Race/Ethnicty Breakdown
| Race/Ethnicty | Total | Percentage |
|---|
| White | 15,964 | 80.74% |
| Black | 930 | 4.7% |
| Hispanic | 2,172 | 10.99% |
| Asian | 643 | 3.25% |
| Native American | 63 | 0.32% |
| Hawaiian/Pac. Islander | 0 | 0% |
60404 Public School Race/Ethnicty Breakdown
| Race/Ethnicty | Total | Percentage |
|---|
| White | 960 | 56.5% |
| Black | 188 | 11.07% |
| Hispanic | 489 | 28.78% |
| Asian | 61 | 3.59% |
| Native American | 1 | 0.06% |
| Hawaiian/Pac. Islander | 0 | 0% |
60404 Educational Attainment Levels
| Highest Education Level Attained | Total | Percentage |
|---|
| Less Than 1 Year of College | 1,011 | 9.06% |
| Bachelor Degree | 2,848 | 25.53% |
| High School Diploma | 2,359 | 21.15% |
| No High School Diploma | 198 | 1.78% |
| GED or Alternate | 316 | 2.83% |
| 1 or More Years of College | 1,878 | 16.84% |
| Associates Degree | 1,153 | 10.34% |
| Masters Degree | 1,076 | 9.65% |
| Professional Degree | 173 | 1.55% |
| Doctorate Degree | 142 | 1.27% |