60438 can be classified socioeconomically as Lower Middle Class class compared to other ZIP Codes in Illinois based on Median Household Income and Average Adjusted Gross Income. The majority race/ethnicity residing in 60438 is African American. The majority race/ethnicity attending public schools in 60438 is African American. The current unemployment level in 60438 is 4.8%.
| Population | 29,059 |
| Population Growth Rate | 0.00% |
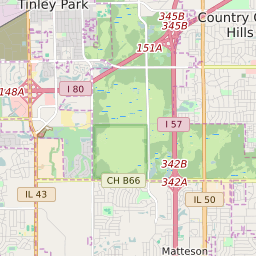
| Population Density | 3,788 People per Square Mile |
| Total Households | 11,545 |
| Percentage High Income Households | 1.7% |
| Median Household Income (2021) | $62,290 |
| Average Adjusted Gross Income (2021) | $375,850 |
| Current Unemployment Rate (January 2025) | 4.8% |
| Majority Race/Ethnicty | African American - 41.68% |
| Public School Majority Race/Ethnicty | African American - 59.98% |
60438 Race/Ethnicty Breakdown
| Race/Ethnicty | Total | Percentage |
|---|
| White | 11,663 | 37.01% |
| Black | 13,136 | 41.68% |
| Hispanic | 5,718 | 18.14% |
| Asian | 707 | 2.24% |
| Native American | 290 | 0.92% |
| Hawaiian/Pac. Islander | 0 | 0% |
60438 Public School Race/Ethnicty Breakdown
| Race/Ethnicty | Total | Percentage |
|---|
| White | 528 | 10.12% |
| Black | 3,290 | 63.06% |
| Hispanic | 1,328 | 25.46% |
| Asian | 46 | 0.88% |
| Native American | 16 | 0.31% |
| Hawaiian/Pac. Islander | 9 | 0.17% |
60438 Educational Attainment Levels
| Highest Education Level Attained | Total | Percentage |
|---|
| Less Than 1 Year of College | 1,603 | 8.93% |
| Bachelor Degree | 2,893 | 16.11% |
| High School Diploma | 5,794 | 32.27% |
| No High School Diploma | 340 | 1.89% |
| GED or Alternate | 633 | 3.53% |
| 1 or More Years of College | 3,663 | 20.4% |
| Associates Degree | 1,951 | 10.86% |
| Masters Degree | 937 | 5.22% |
| Professional Degree | 131 | 0.73% |
| Doctorate Degree | 12 | 0.07% |