61356 can be classified socioeconomically as Lower Middle Class class compared to other ZIP Codes in Illinois based on Median Household Income and Average Adjusted Gross Income. The majority race/ethnicity residing in 61356 is White. The majority race/ethnicity attending public schools in 61356 is White. The current unemployment level in 61356 is 4.8%.
| Population | 10,959 |
| Population Growth Rate | 0.00% |
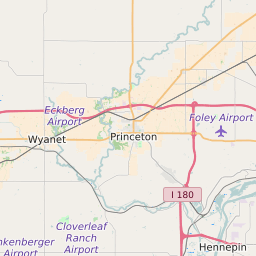
| Population Density | 62 People per Square Mile |
| Total Households | 4,858 |
| Percentage High Income Households | 3.2% |
| Median Household Income (2021) | $59,406 |
| Average Adjusted Gross Income (2021) | $490,590 |
| Current Unemployment Rate (January 2025) | 4.8% |
| Majority Race/Ethnicty | White - 93.98% |
| Public School Majority Race/Ethnicty | White - 89.05% |
61356 Race/Ethnicty Breakdown
| Race/Ethnicty | Total | Percentage |
|---|
| White | 10,156 | 93.98% |
| Black | 4 | 0.04% |
| Hispanic | 480 | 4.44% |
| Asian | 166 | 1.54% |
| Native American | 0 | 0% |
| Hawaiian/Pac. Islander | 0 | 0% |
61356 Public School Race/Ethnicty Breakdown
| Race/Ethnicty | Total | Percentage |
|---|
| White | 1,423 | 91.1% |
| Black | 10 | 0.64% |
| Hispanic | 103 | 6.59% |
| Asian | 18 | 1.15% |
| Native American | 5 | 0.32% |
| Hawaiian/Pac. Islander | 3 | 0.19% |
61356 Educational Attainment Levels
| Highest Education Level Attained | Total | Percentage |
|---|
| Less Than 1 Year of College | 694 | 9.31% |
| Bachelor Degree | 1,119 | 15.01% |
| High School Diploma | 2,834 | 38.01% |
| No High School Diploma | 99 | 1.33% |
| GED or Alternate | 377 | 5.06% |
| 1 or More Years of College | 1,199 | 16.08% |
| Associates Degree | 519 | 6.96% |
| Masters Degree | 435 | 5.83% |
| Professional Degree | 144 | 1.93% |
| Doctorate Degree | 36 | 0.48% |